🌍 Public
Revit to Neo4j
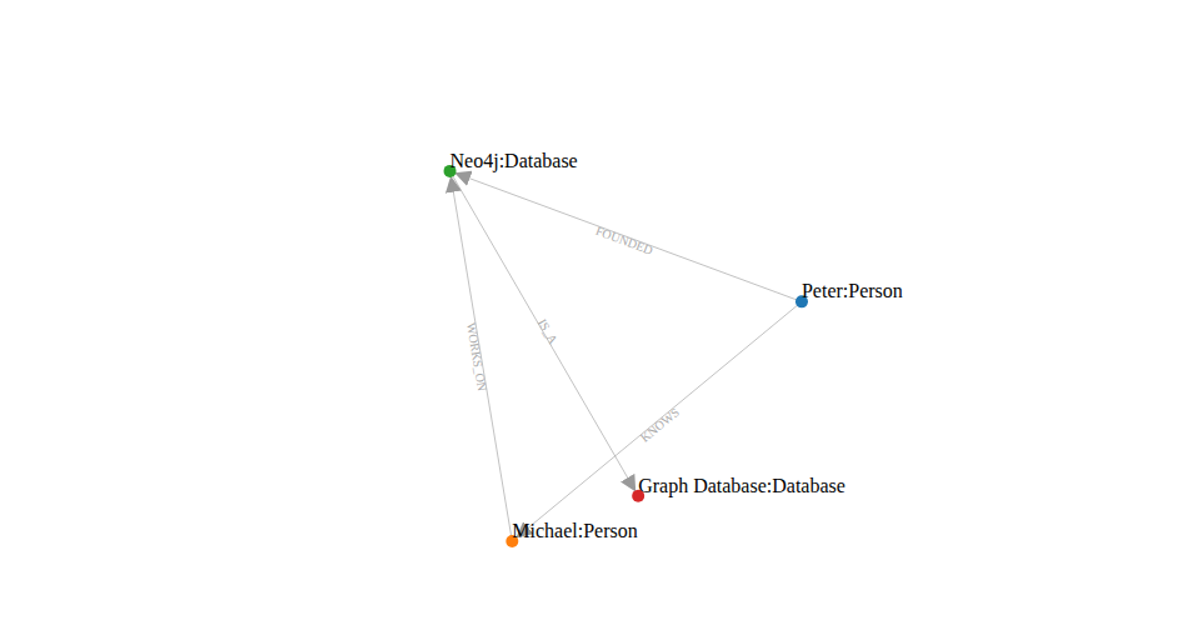
This visualization displays a network of rooms in a floor plan, with nodes representing spaces like "Kitchen" and "Bedroom" and links showing connections between them, rendered as an interactive SVG. It uses `d3.forceSimulation` with `forceManyBody`, `forceLink`, and `forceCenter` forces to position nodes, while `d3.drag` enables user interaction. The graph is built from hardcoded data in `data.js` and styled with light gray circles, red text labels, and black link lines.
AI-generated descriptionA bare minimum HTML page demonstrating use of CSS and JavaScript.
See also React Starter.
MIT Licensed




Comments
Sign in to join the discussion.