index.html
<!DOCTYPE html>
<html>
<head>
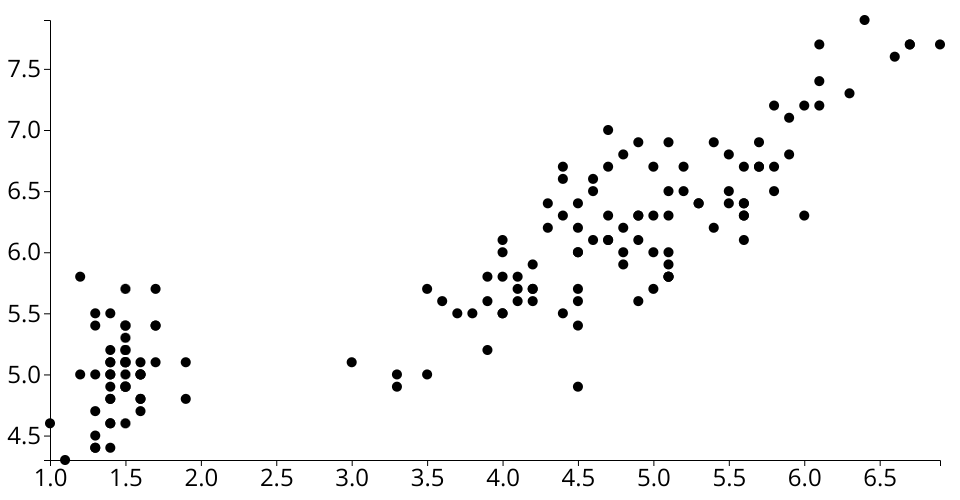
<title>D3 Scatter Plot</title>
<style>
body {
margin: 0;
overflow: hidden;
}
.tick text {
font-size: 24px;
}
</style>
<script src="https://unpkg.com/d3@6.7.0/dist/d3.min.js"></script>
</head>
<body>
<script>
const {
csv,
select,
scaleLinear,
extent,
axisLeft,
axisBottom,
} = d3;
const csvUrl = [
'https://gist.githubusercontent.com/',
'curran/', // User
'a08a1080b88344b0c8a7/', // Id of the Gist
'raw/0e7a9b0a5d22642a06d3d5b9bcbad9890c8ee534/', // commit
'iris.csv', // File name
].join('');
const parseRow = (d) => {
d.sepal_length = +d.sepal_length;
d.sepal_width = +d.sepal_width;