index.html
<!DOCTYPE html>
<html>
<head>
<title>
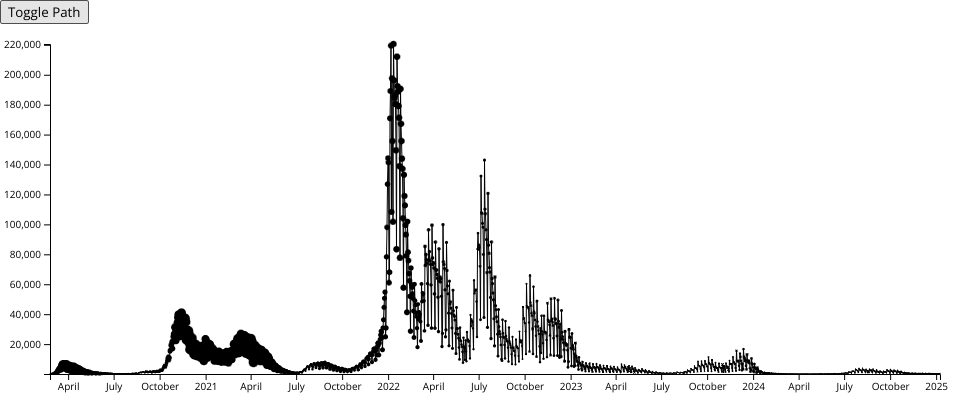
Fork of Daily new cases of Covid in Italy (Episode 8)
</title>
<style>
/* hide scrollbar for a full window svg*/
body {
margin: 0;
overflow: hidden;
}
</style>
<!-- use browser global (we are in a Vanilla fashion) -->
<script src="https://unpkg.com/d3@6.7.0/dist/d3.min.js"></script>
</head>
<body>
<button onclick="toggle()">Toggle Path</button>
<script>
// instead of using d3.csv all the time. It's a kind of destructuring close to what we'd do with ES6 modules
// const { csv } = d3; // equivalent to const csv = d3.csv;
const {
csv,
select,
scaleLinear,
scaleTime,
extent,
axisLeft,
axisBottom,
line,
scaleSqrt,
max,
} = d3;
// toggle path
const toggle = () => {
Covid pandemic in Italy
This scatterplot shows the time series of daily new cases of Covid in Italy.
- x-axis exploits
scaleTime - the radius of points is proportional (i.e.,
scaleLinear) to the amount of patients in intensive care on a daily basis - use the button in the top-left corner to toggle the path
- Data source (continuously updated)
MIT Licensed