🌍 Public
CV: Interactive Color Legend
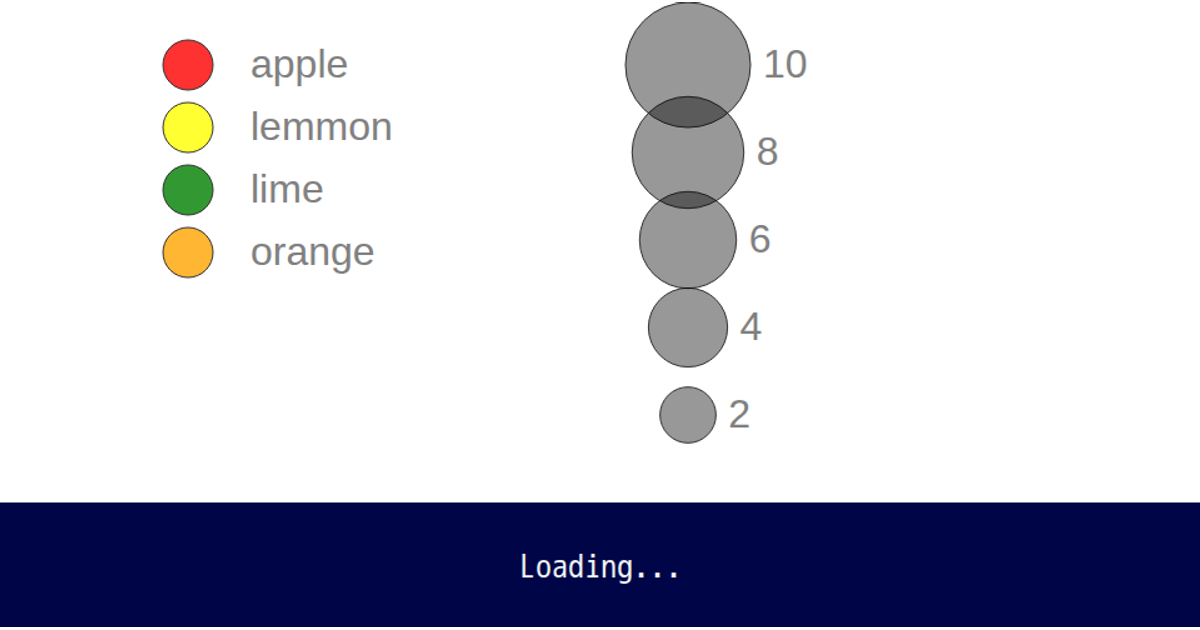
This example presents an interactive color legend using D3 and React. Five colored circles and their corresponding labels display a categorical color scale, and hovering over a circle highlights it while dimming the others through animated opacity transitions. The visualization uses D3 v7’s `scaleOrdinal` to map domain values A through E to distinct colors, while React state tracks the hovered circle. The `viz` function renders the legend, with `renderCircles` and `renderText` managing SVG elements via data joins and seamless 300-millisecond transitions.
AI-generated descriptionMIT Licensed





Comments
Sign in to join the discussion.