index.js
import React, {
useState,
useCallback,
useEffect,
} from 'react';
import ReactDOM from 'react-dom';
import { csv, scaleLinear, max, format, extent } from 'd3';
import { useData } from './useData';
import { AxisBottom } from './AxisBottom';
import { AxisLeft } from './AxisLeft';
import { Marks } from './Marks';
const width = 960;
const height = 500;
const margin = {
top: 20,
right: 30,
bottom: 65,
left: 90,
};
const xAxisLabelOffset = 50;
const yAxisLabelOffset = 45;
const App = () => {
const data = useData();
if (!data) {
return <pre>Loading...</pre>;
}
const innerHeight = height - margin.top - margin.bottom;
const innerWidth = width - margin.left - margin.right;
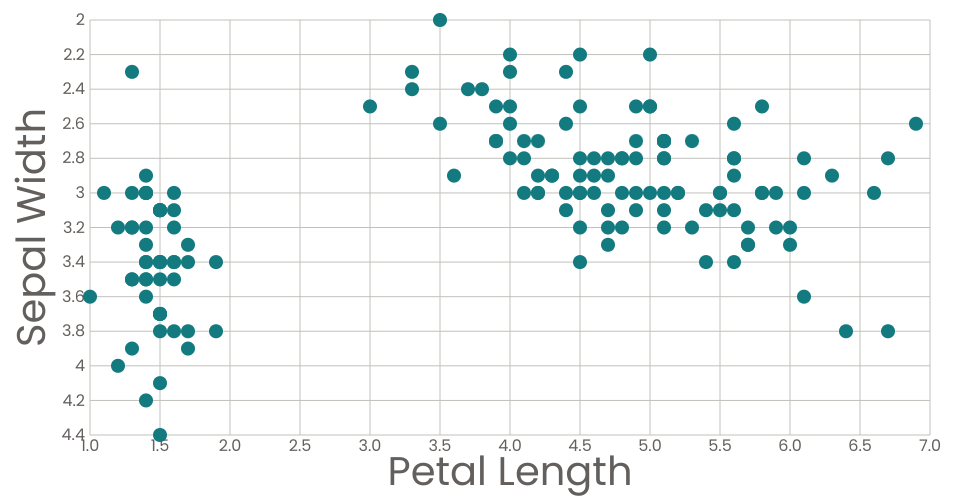
const xValue = (d) => d.petal_length;
const xAxisLabel = 'Petal Length';