🌍 Public
Fork of CV: Scatter Plot with Density Contours
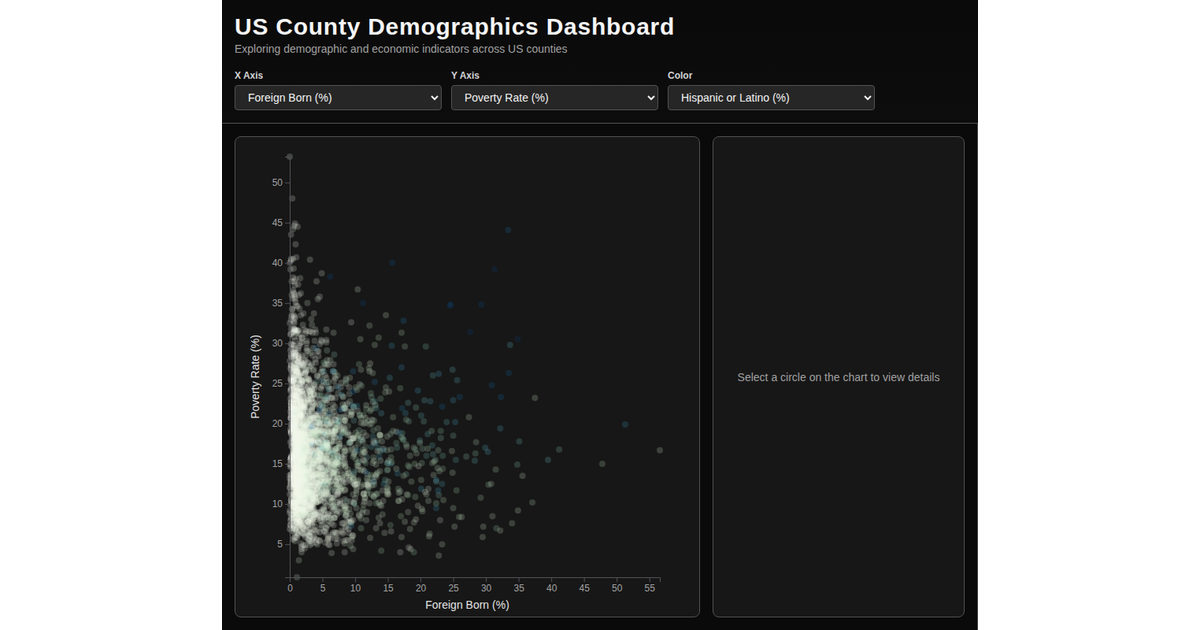
A scatter plot with density contours maps US counties by demographic indicators like foreign-born population and poverty rate, using a dropdown to switch between quantitative census variables. The visualization renders D3 contourDensity-generated paths with color-coded intensity gradients over log-scaled axes, animated via D3 transitions. Data loads from a CSV of county facts, with SVG rendering and smooth axis updates handled by D3 v7 and React state.
AI-generated descriptionMIT Licensed




Comments
Sign in to join the discussion.