🌍 Public
CV: Categorical Scatter Plot
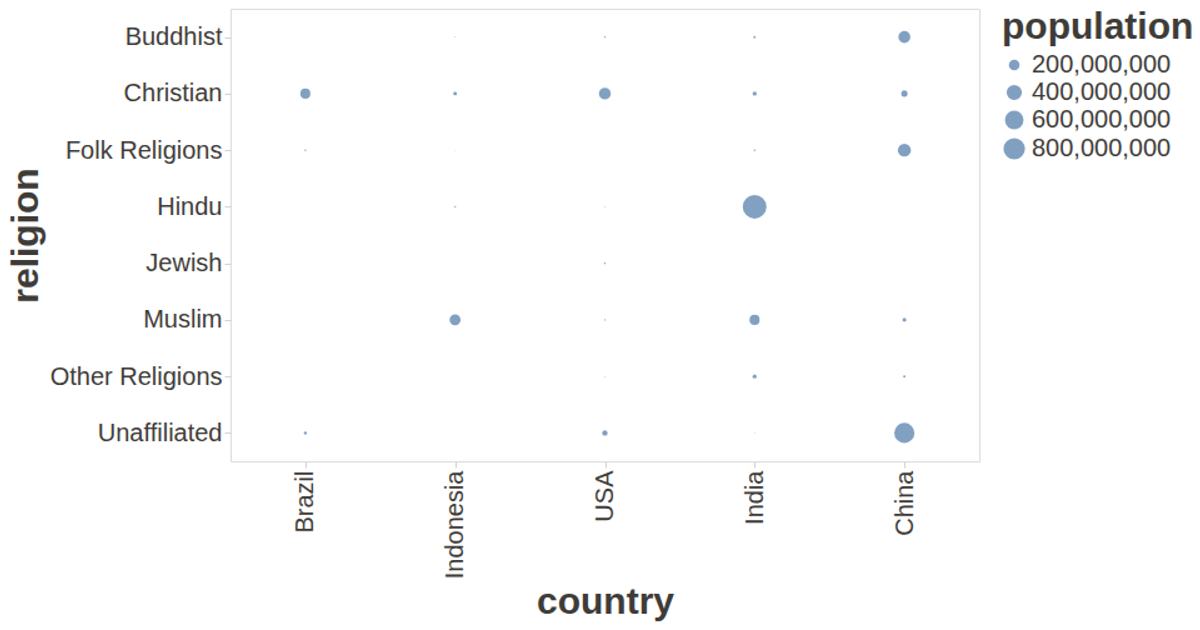
This categorical scatter plot visualizes the population of religious groups across multiple countries, with each circle’s area proportional to population size. The chart uses a band scale for both the x-axis (country) and y-axis (religion), revealing the distribution and relative magnitudes of each religious demographic. Built with React and D3 v7, the visualization renders as SVG, using `scaleBand`, `scaleSqrt`, and `scaleOrdinal` to position and size the bubbles, with the `csv` module loading the data from an external file.
AI-generated descriptionMIT Licensed




Comments
Sign in to join the discussion.