🌍 Public
hw10 - add axis labels to Animated Reusable D3 Scatter Plot
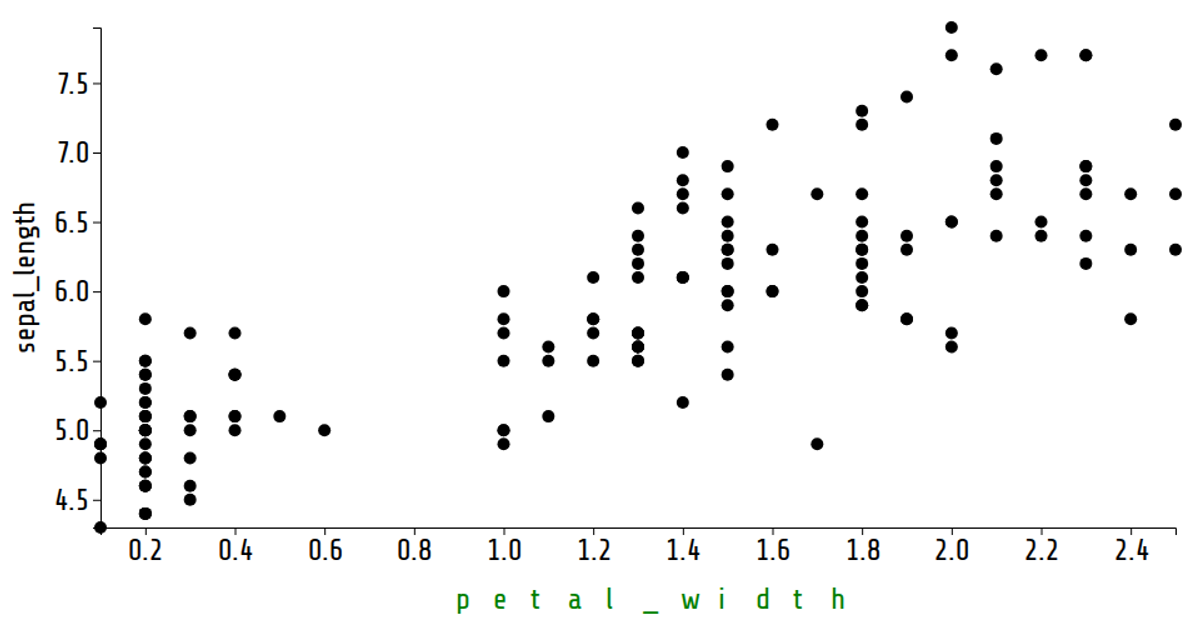
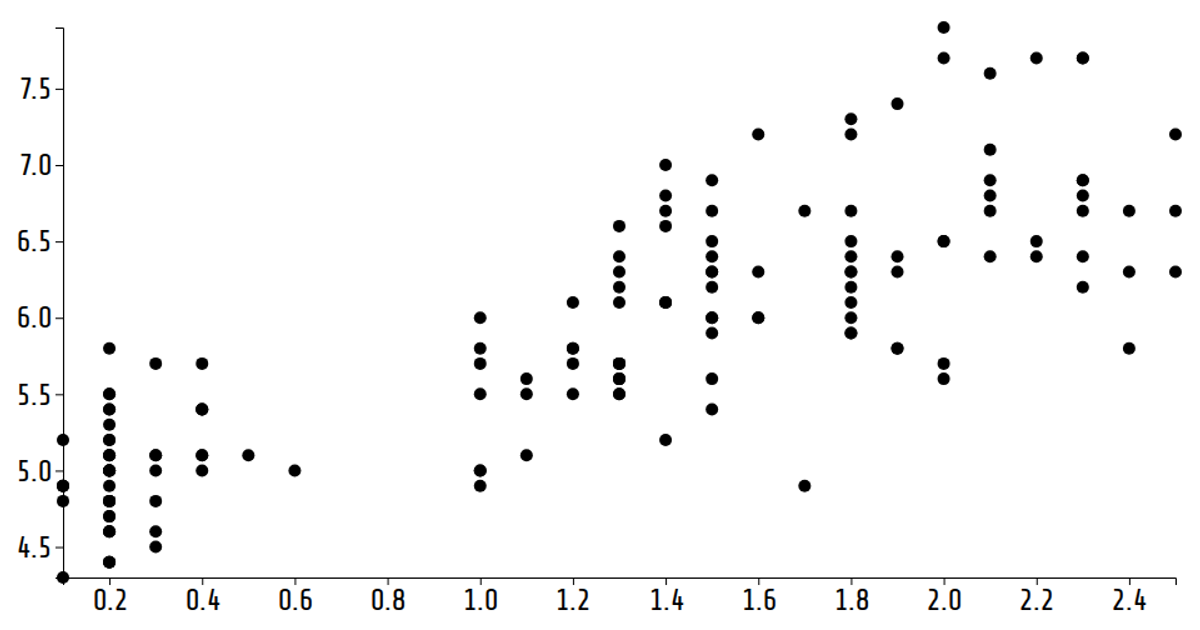
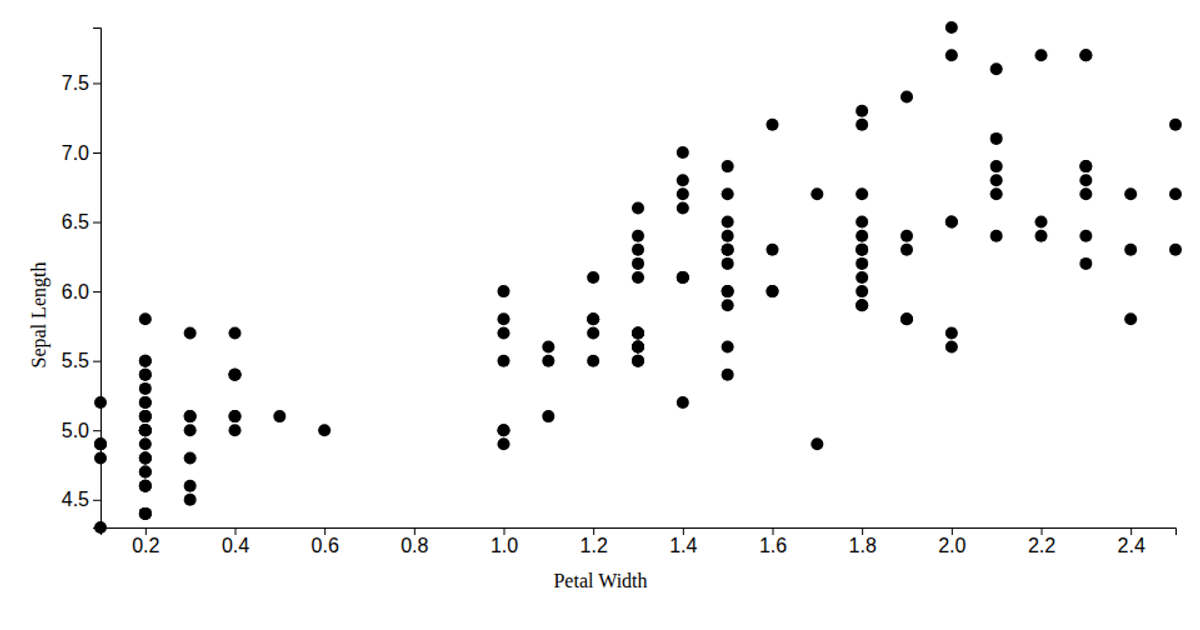
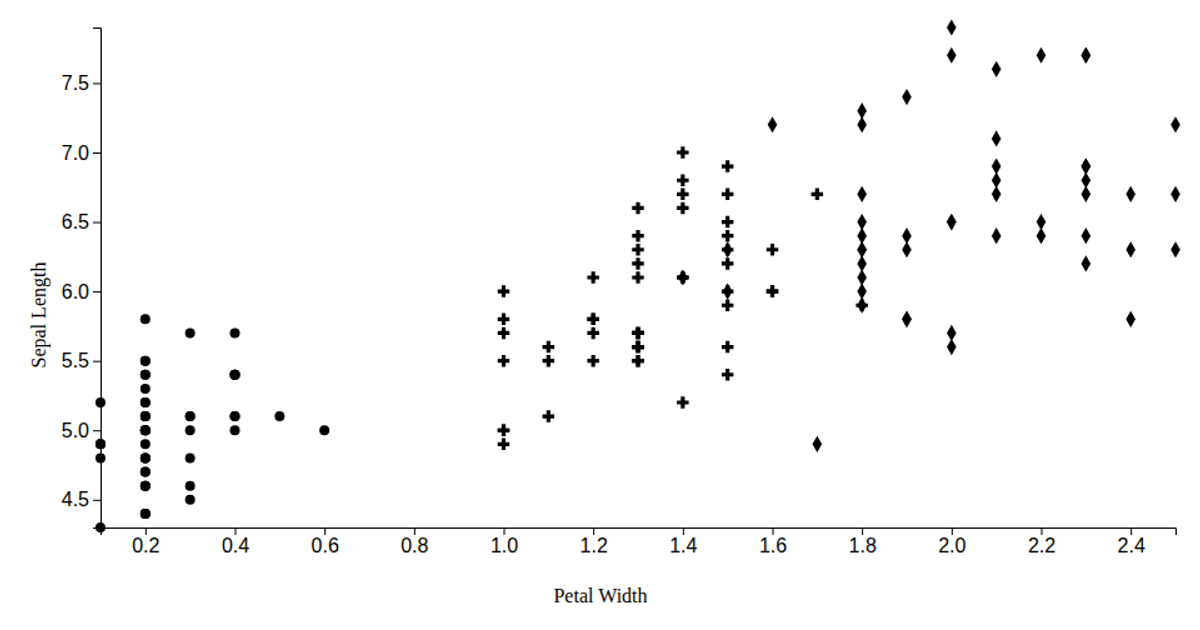
This animated scatter plot visualizes the Iris dataset with petal width mapped to the x-axis and sepal length on the y-axis, using D3 v6’s `scaleLinear`, `axisLeft`, and `axisBottom` to render axes. Circles representing data points transition smoothly via `selection.join` and `transition` as the x-axis variable cycles through the dataset’s numeric columns every 30 seconds. SVG labels for each axis are configured through custom `xLabel` and `yLabel` accessor functions, demonstrating a reusable chart pattern inspired by Bostock’s “Towards Reusable Charts.”
AI-generated descriptionA reusable scatter plot inspired by Towards Reusable Charts and Observable: selection.join.
Shows the Iris Dataset.
MIT Licensed




Comments
Sign in to join the discussion.