Skip to main content
Explore
Solutions
Services
Pricing
Quick Start
Demo
Start free
Log in
Send feedback
✕
Tell us what works and what could be better. We read every submission.
Send feedback
✕
Tell us what works and what could be better. We read every submission.
C
chakritha06
@chakritha06
·
22 public vizzes
ICE-8
Jul 10, 2022
Tree Example: ICE-8
Jul 10, 2022
India Map
Jul 10, 2022
World maps by using D3.js
Jul 10, 2022
Untitled
Jul 7, 2022
3D Bar Chart
Jul 7, 2022
ICE - 7
Jul 3, 2022
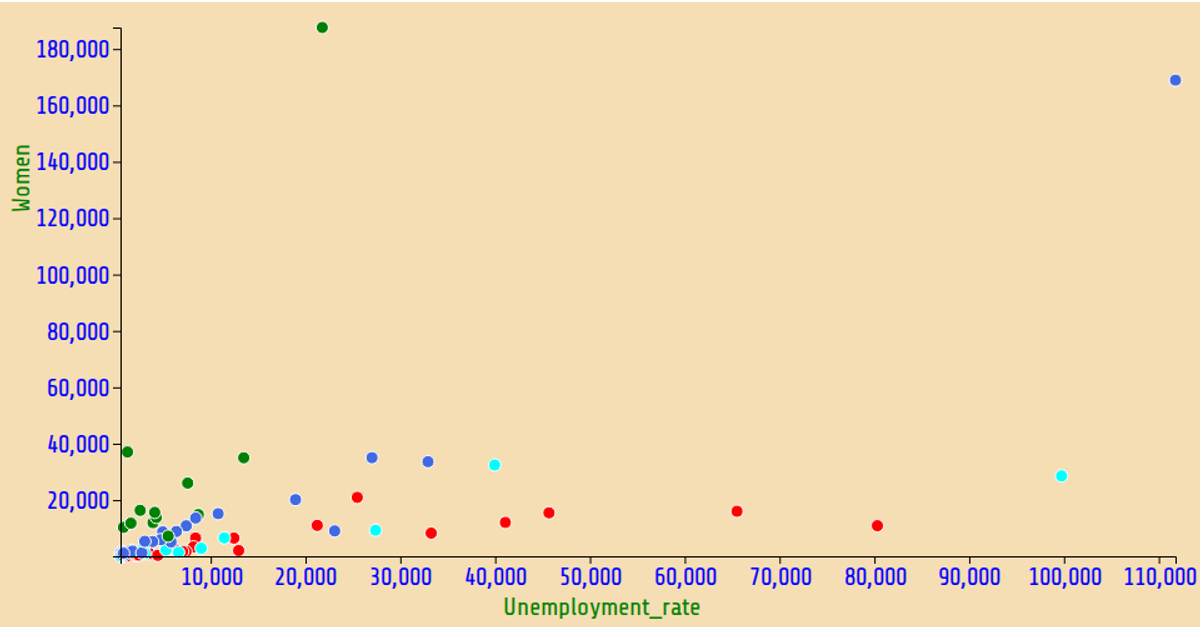
Data Visualization ICE6: Fork of Iris Dataset Scatter Plot
Jul 3, 2022
Data Visualization ICE7: Fork of Iris Dataset Scatter Plot
Jul 3, 2022
Area Chart Visualization
Jul 3, 2022
Area Chart Visualization
Jul 3, 2022
line chart visualization
Jul 2, 2022
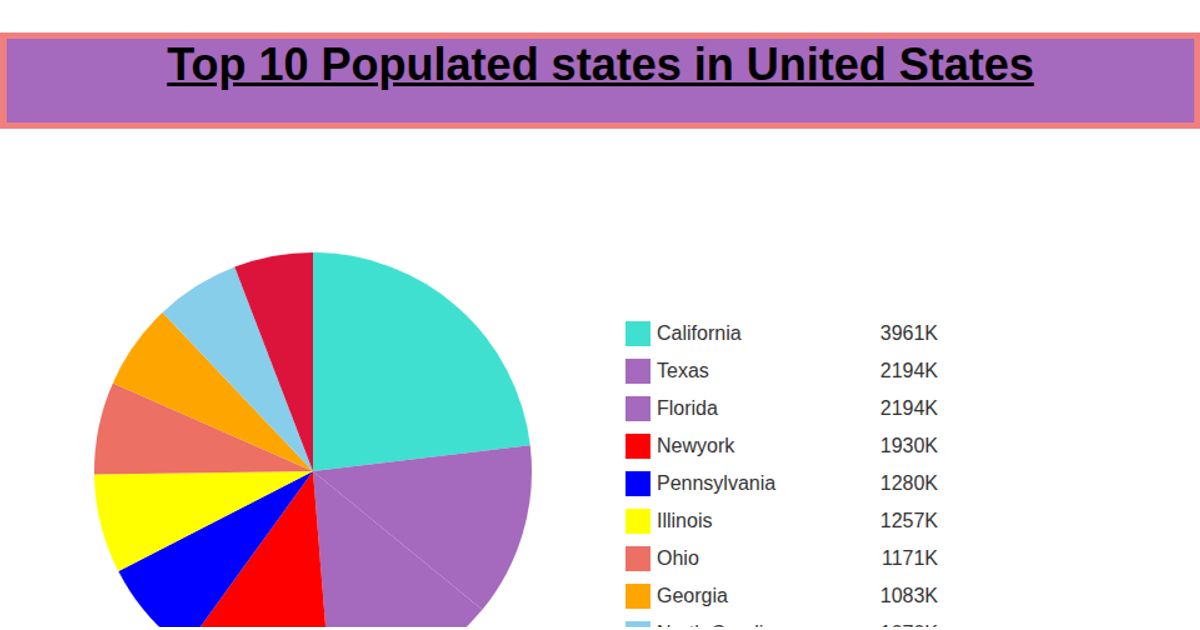
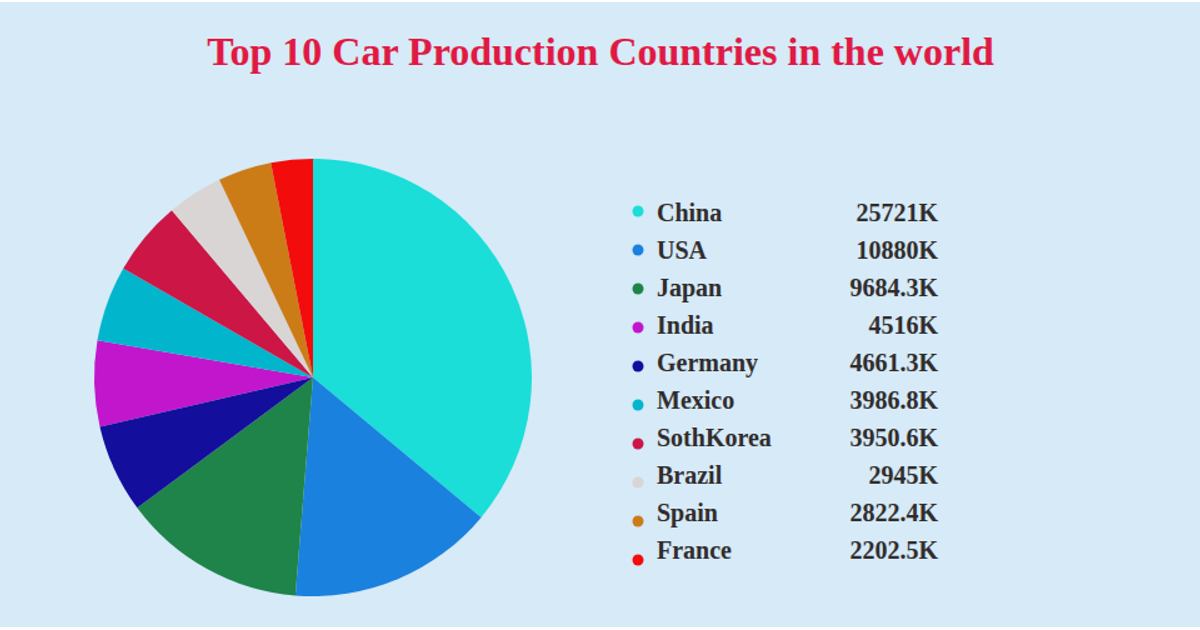
ICE - 7 Pie Chart
Jul 2, 2022
Fork of ICE 7 Pie Chart
Jul 2, 2022
Fork of Interactive Color Legend
Jul 1, 2022
Fork of Reusable D3 Scatter Plot
Jul 1, 2022
Data visualization ICE-6: Rendering Marks and Channels with React & D3
Jun 25, 2022
Chakritha Dondapati
Jun 23, 2022
Chakritha Dondapati
Jun 22, 2022
Fork of Hello VizHub
Jun 22, 2022
smiley
Jun 18, 2022
Fork of Smiley Face Part V
Jun 18, 2022