🌍 Public
Project Brand vs. Avg Cost
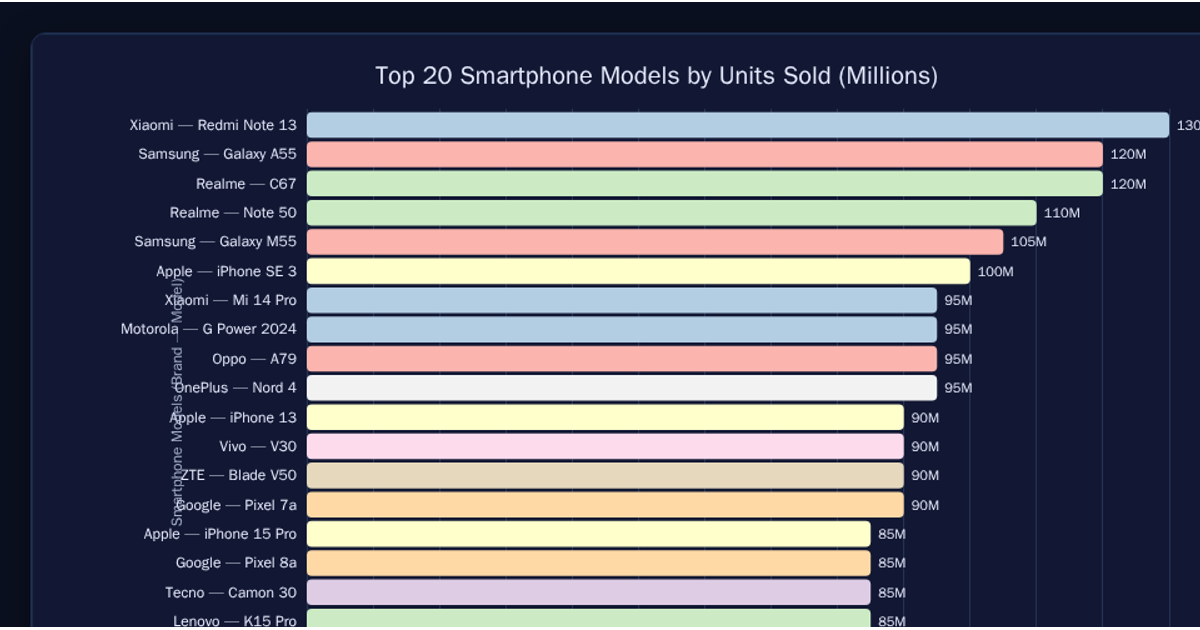
This bar chart compares the average cost (x-axis) across various smartphone brands (y-axis), using data from a CSV file loaded with d3.csv. The visualization sorts the data by price and displays the top 500 entries as horizontal bars rendered as SVG `<rect>` elements via React. Axes are built using d3.scaleBand and d3.scaleLinear, with tick labels formatted using d3.format. Hovering over a bar reveals its precise value through an SVG `<title>` tooltip.
AI-generated descriptionMIT Licensed




Comments
Sign in to join the discussion.