🌍 Public
activity6_ques1_task2
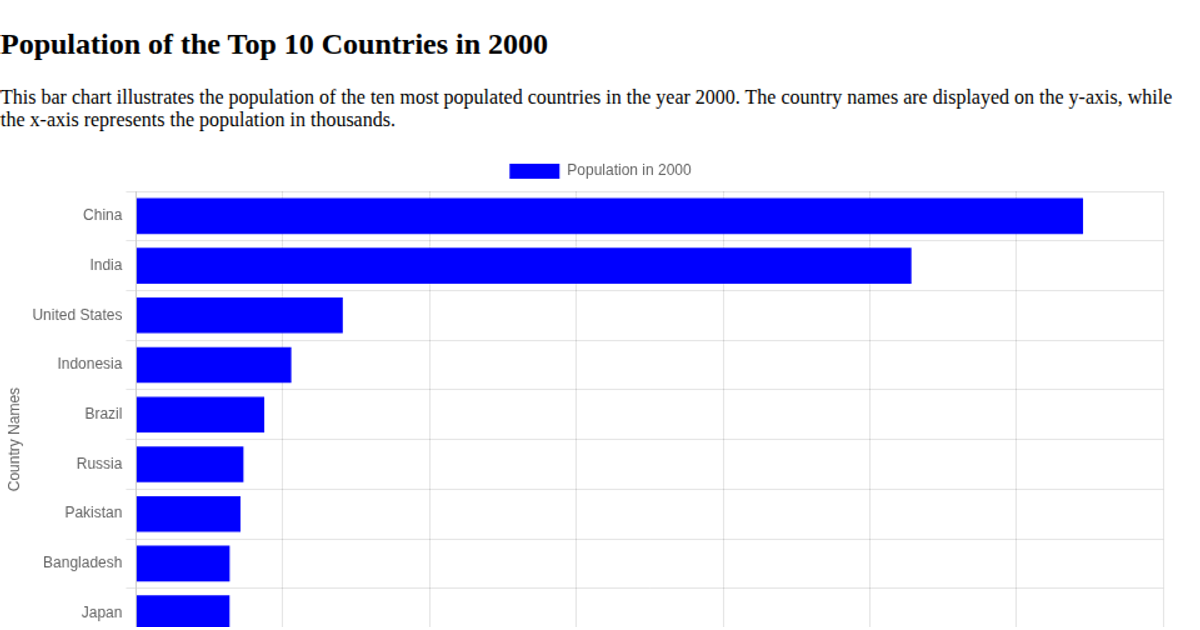
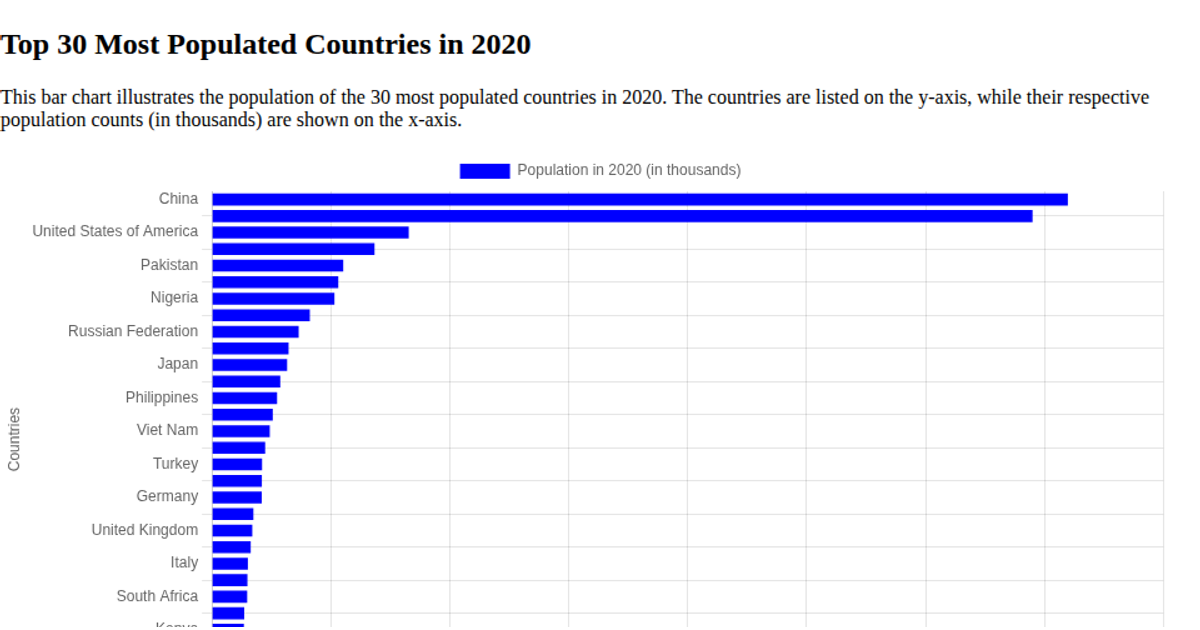
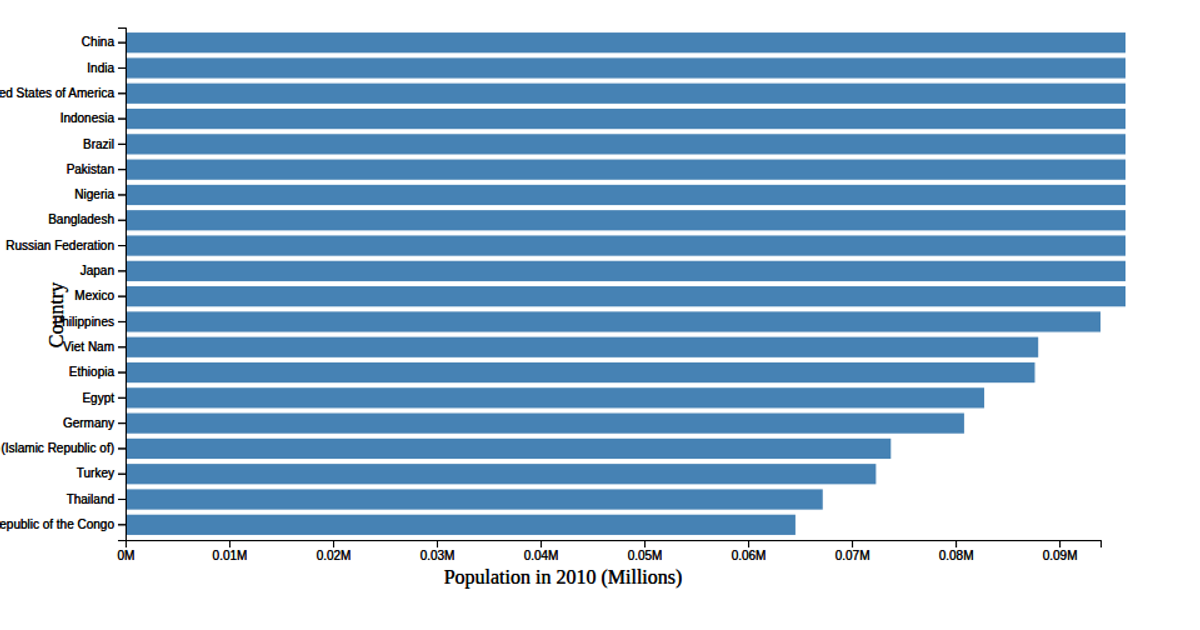
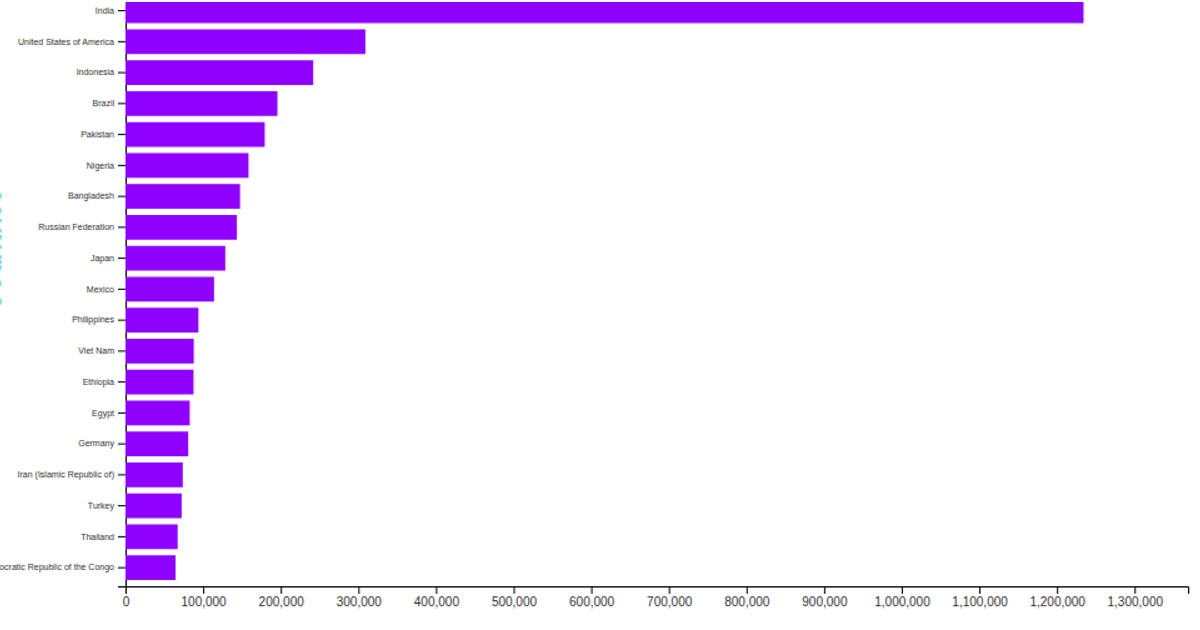
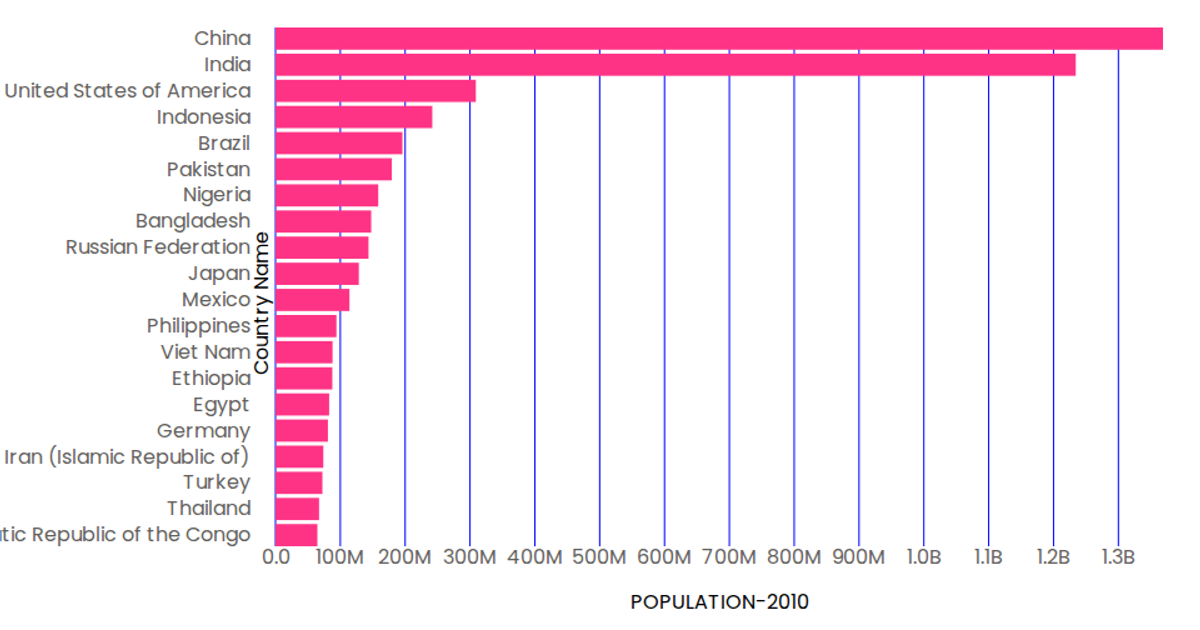
This example displays a horizontal bar chart of the top 20 most populous countries in 2010, using the Chart.js library within an HTML Canvas element. The visualization clearly ranks countries from China to the Democratic Republic of the Congo, with the x-axis representing population counts and the y-axis listing country names. The chart's data is sourced from a hard-coded array of country population statistics. All bars share a uniform blue color to facilitate quick comparison of population magnitudes.
AI-generated descriptionMIT Licensed


Comments
Sign in to join the discussion.