A visualization constructed using the vega-lite-api.
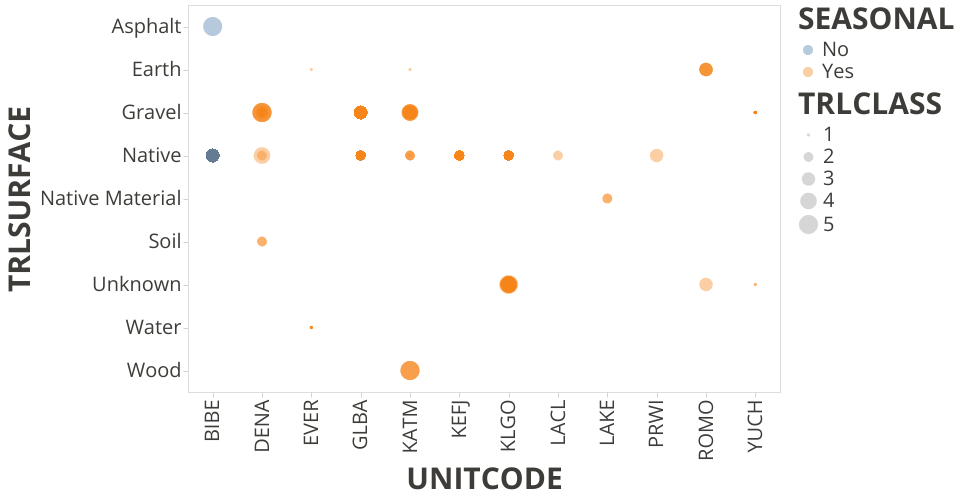
The data shown here comes from the bbbbrianna gist National Park Trail.
This visualization shows surface of the trails in national parks. The more opaque the dot is, the larger amount of that class trail in one national park. Dot size shows the wellness of the trail, class 5 means the trail is completely well developed, and class 1 means that is barelt developed.
MIT Licensed