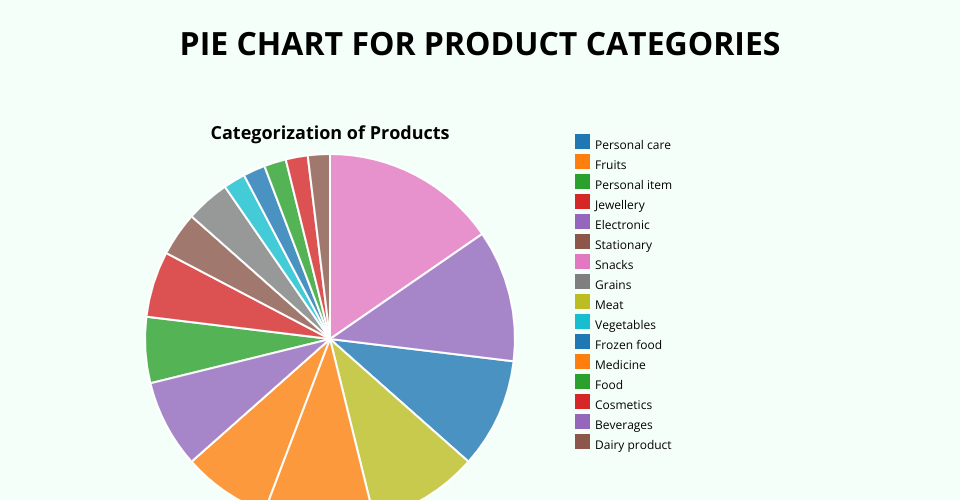
This project visualizes product distribution of data using D3.js,focusing on two key visualizations: PIE-CHART:To display the categorization of products by type. VISUALIZATIONS: Pie-chart:product categories. Displays product counts for each category(e.g;snacks,Beverages,personal care etc) Includes a color-coded legend for clarity. used d3.pie and d3.arc() to render chart.
MIT Licensed