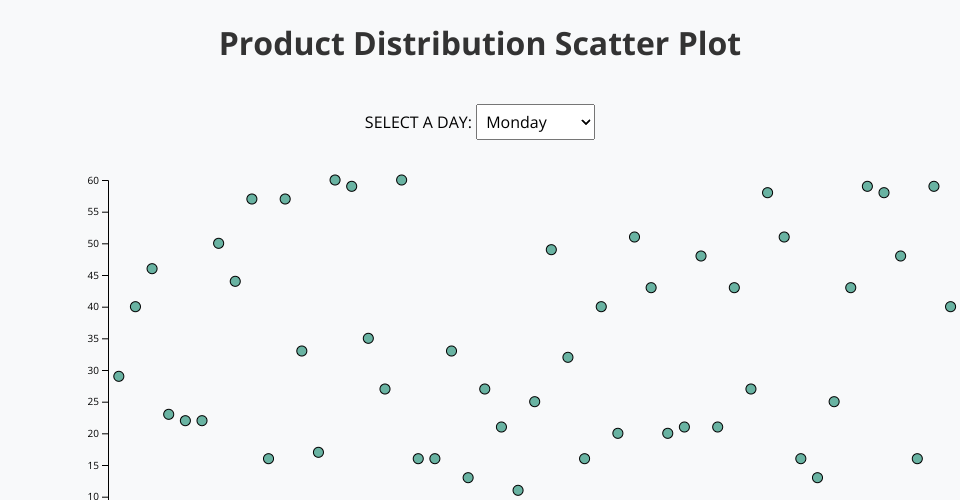
This project is a D3.js- based interactive scatter plot that visualizes the distribution of various products across different days of the weeek. Features: Dynamic scatter plot: Visualizes product distribution values for any selected day. Day selector: Switch between Monday to Sunday to update the plot. Tooltips: Hover over each data point to see exact values and product names. Reusable design: Easily extensible for new datasets or attributes.
MIT Licensed