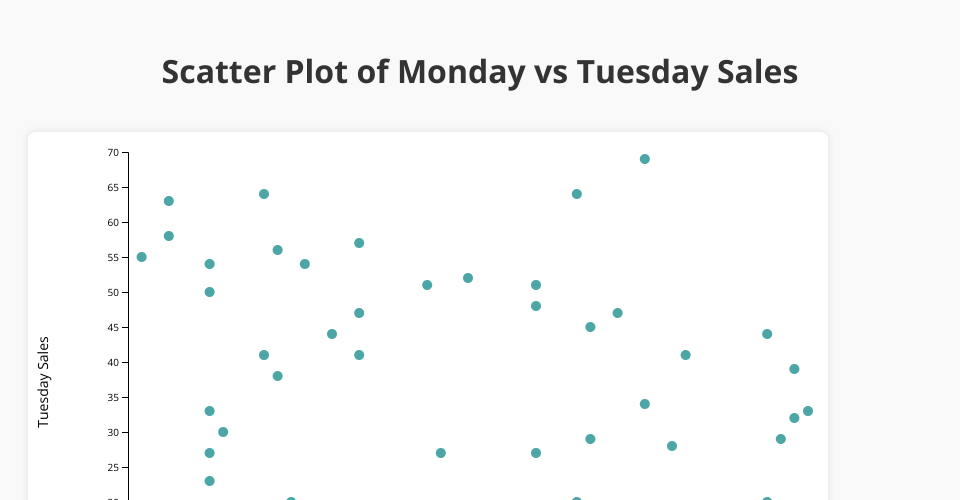
This project visualizes product sales data using a scatter plot, specifically comparing "Monday vs Tuesday" sales for different products. FEATURES: Built with HTML,CSS and D3.js Fully responsive SVG-based scatter plot. Visualizes the relationship between Monday and Tuesday sales. Includes labeled axes and interactive tooltips for each data points. Technologies used: D3.js for data driven visualizations. HTML5 & CSS3 for layout and styling. AUTHOR: Sowmya Sree Aitharaju.
MIT Licensed