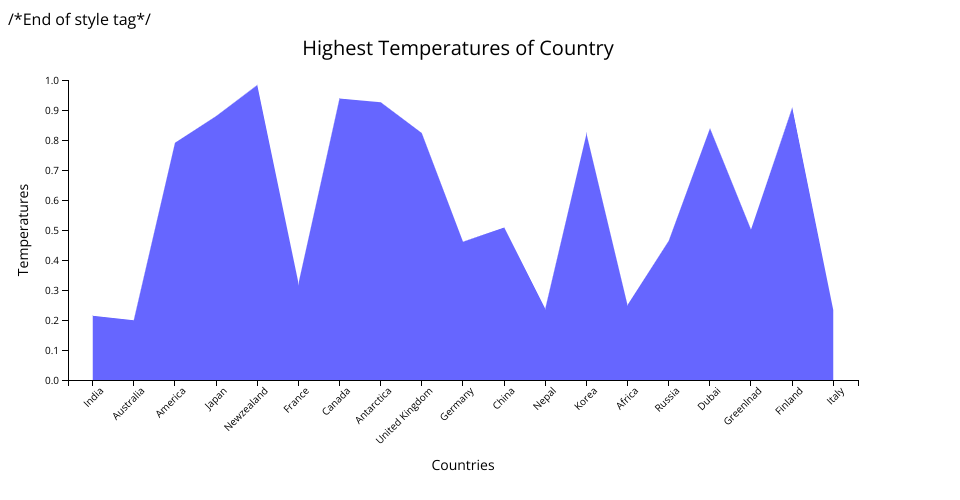
This project visualizes the normalized highest temperatures recorded across variouscontries using as interactive area chart created with D3.js. Features: Area chart showing temperature trends by country. Axis labels and smooth area tansitions.
MIT Licensed