🌍 Public
Fork of Stylized Line Chart
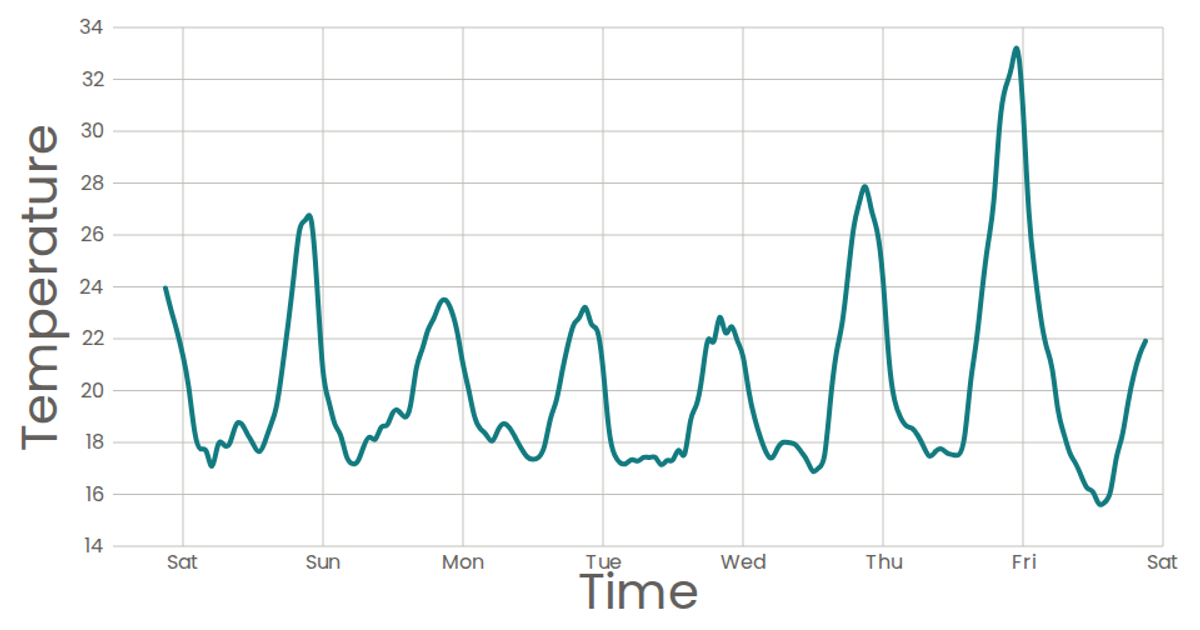
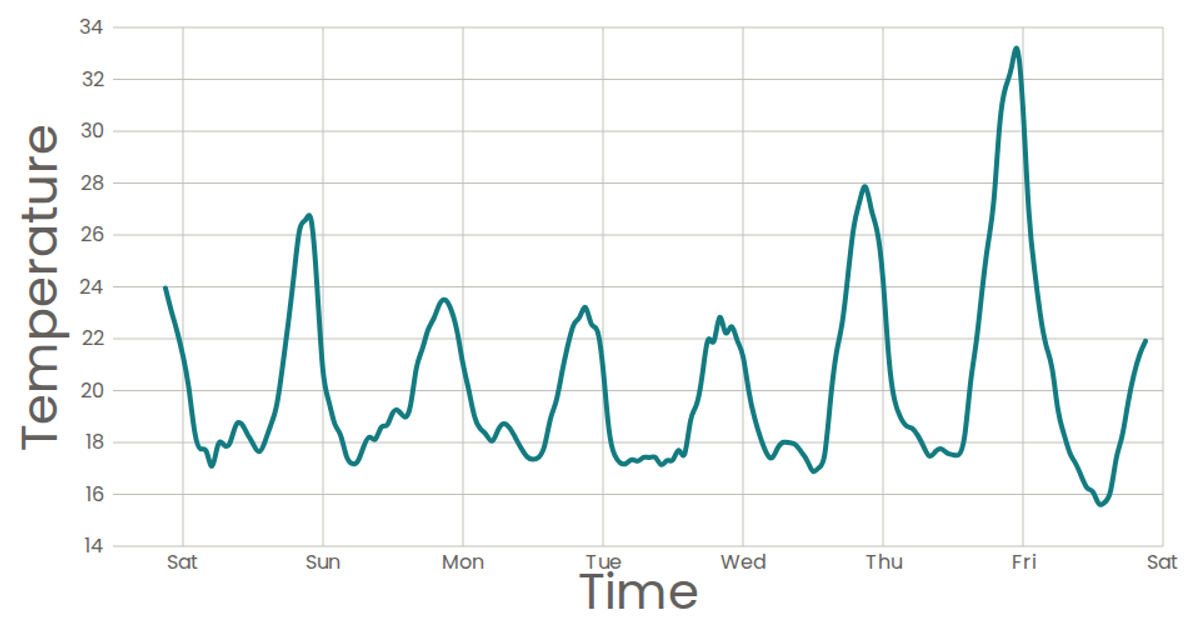
This stylized line chart visualizes temperature over time from a week of San Francisco data, using a natural curve to connect the data points. The chart is built with React and D3 v5, using `scaleTime` and `scaleLinear` to map the data to SVG coordinates. The `line()` function with `curveNatural` creates the smooth path, while axes are rendered via custom components. The chart omits circles for data points, relying solely on the bold teal path to communicate the trend.
AI-generated descriptionA scatter plot of Data Canvas Sense Your City Dataset.
MIT Licensed





Comments
Sign in to join the discussion.