Line Chart - Assignment 7
This project shows a line chart using D3.js.
Dataset
File used: student_scores.csv
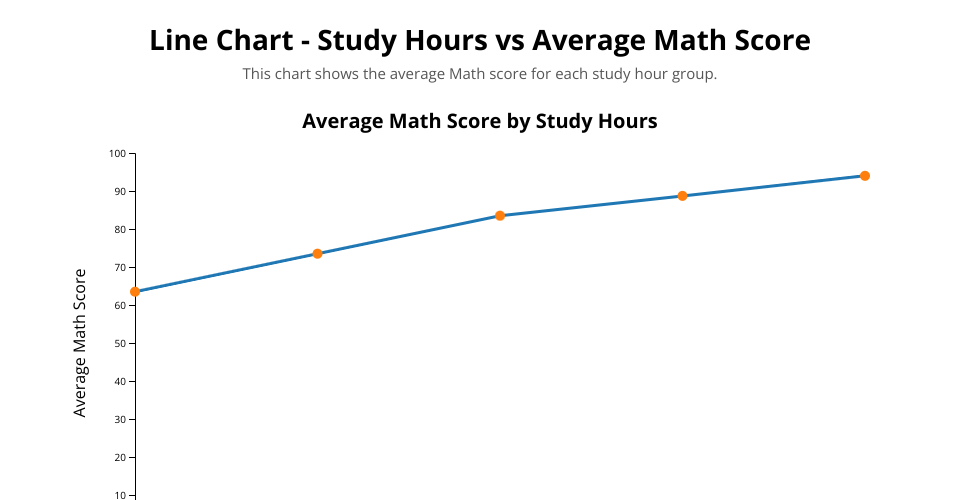
Visualization
- X-axis: Hours of Study
- Y-axis: Average Math Score
Explanation
This chart shows how the average Math score changes with study hours.
Author
Ariful Hasan
MIT Licensed