Pie Chart - Assignment 7
This project shows a pie chart using D3.js.
Dataset
File used: student_scores.csv
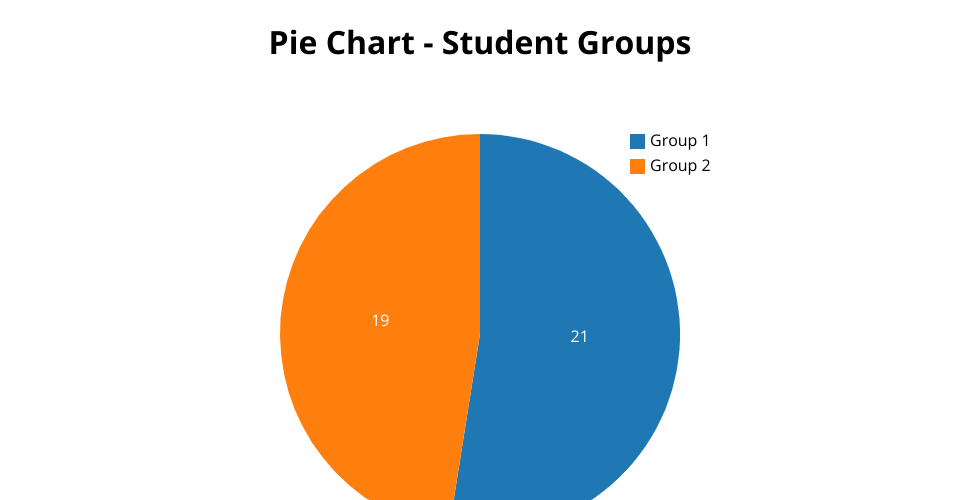
Visualization
This pie chart shows the number of students in each group.
Explanation
Each slice represents a group. The size of each slice shows how many students are in that group.
Author
Ariful Hasan
MIT Licensed