Reusable Scatter Plot - Assignment 7
This project shows a reusable scatter plot using D3.js.
Dataset
File used: student_scores.csv
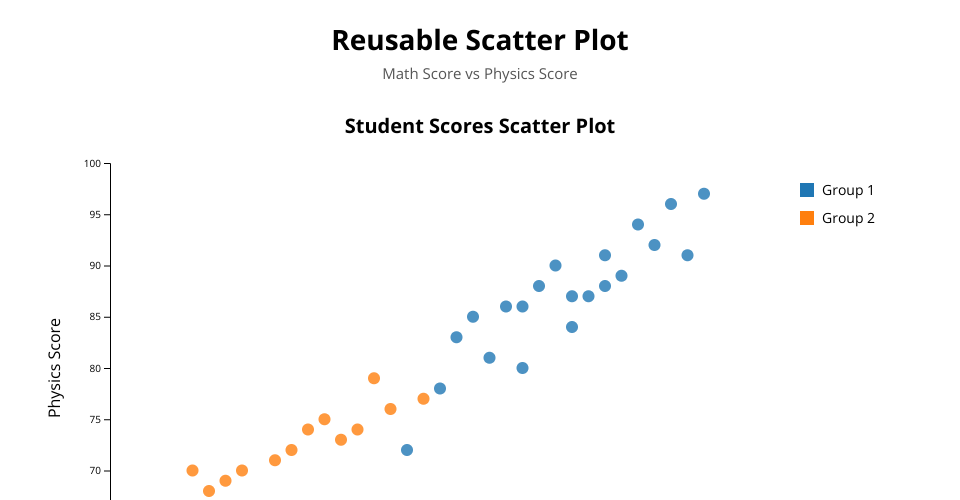
Visualization
- X-axis: Math Score
- Y-axis: Physics Score
- Color: Group
Why this chart is reusable
This chart is reusable because the same function can be used again with different:
- datasets
- x-axis attributes
- y-axis attributes
- chart size
- color categories
Example
In this chart, each point represents one student. The chart shows the relationship between Math score and Physics score.
Author
Ariful Hasan
MIT Licensed