Area Chart - Assignment 7
This project shows an area chart using D3.js.
Dataset
File used: student_scores.csv
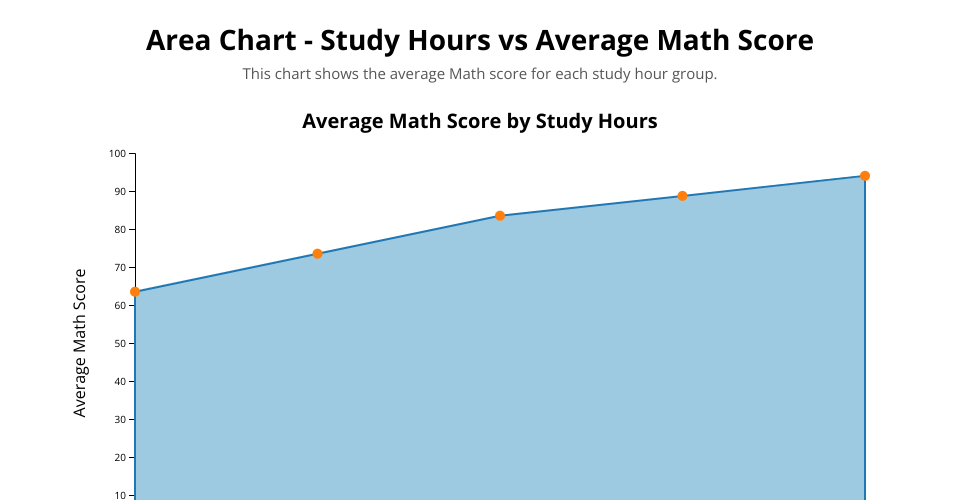
Visualization
- X-axis: Hours of Study
- Y-axis: Average Math Score
Explanation
This chart shows how the average Math score changes with study hours. The filled area helps show the magnitude of the values.
Author
Ariful Hasan
MIT Licensed