Bigfoot Visualization
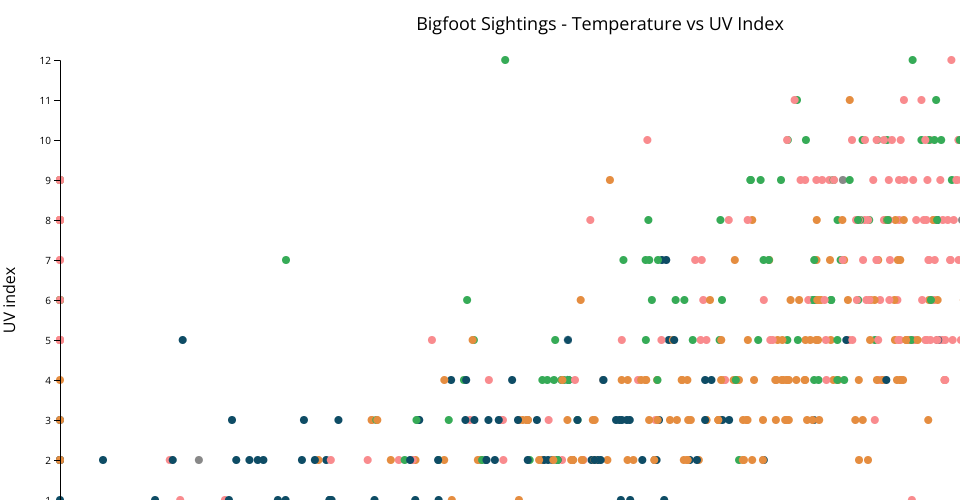
This data can be found here: https://data.world/timothyrenner/bfro-sightings-data and pulls from Bigfoot Field Researchers Organization (BFRO) data set. There are 5000+ rows, but I cut it down for this viz to the first 1000. It references sightings across the US in a wide range of time from 1970's to the last couple years.
It displays a scatter plot showing the relationship between temperature (mid-range) and reported uv index color-coded by season.
MIT Licensed