This data can be found here: https://data.world/timothyrenner/bfro-sightings-data and pulls from Bigfoot Field Researchers Organization (BFRO) data set. There are 5000+ rows, but I cut it down for this viz to the first 1000. It references sightings across the US in a wide range of time from 1970's to the last couple years.
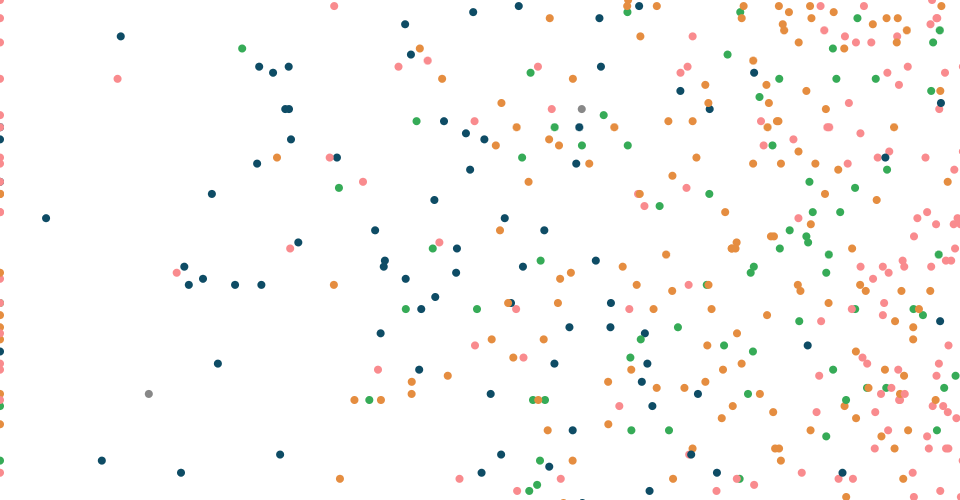
This viz includes mapping the temperature_mid to the moon_phase and also color coding the points by season (summer, spring, fall, winter, unknown)
Attributes include the following:
- Observed date and time
- Location details
- County
- State
- Season
- Title
- Latitude
- Longitude
- Classification
- Geohash
- Temperature_high
- Temperature_mid
- Temperature_low
- Dew point
- Humidity
- Cloud_cover
- Moon_phase
- Precip_intensity
- Precip_probability
- Precip_type
- Pressure
- Summary
- uv_index
- Visibility
- Wind_bearing
- Wind_speed
MIT Licensed