🌍 Public
Vega-Lite API Template
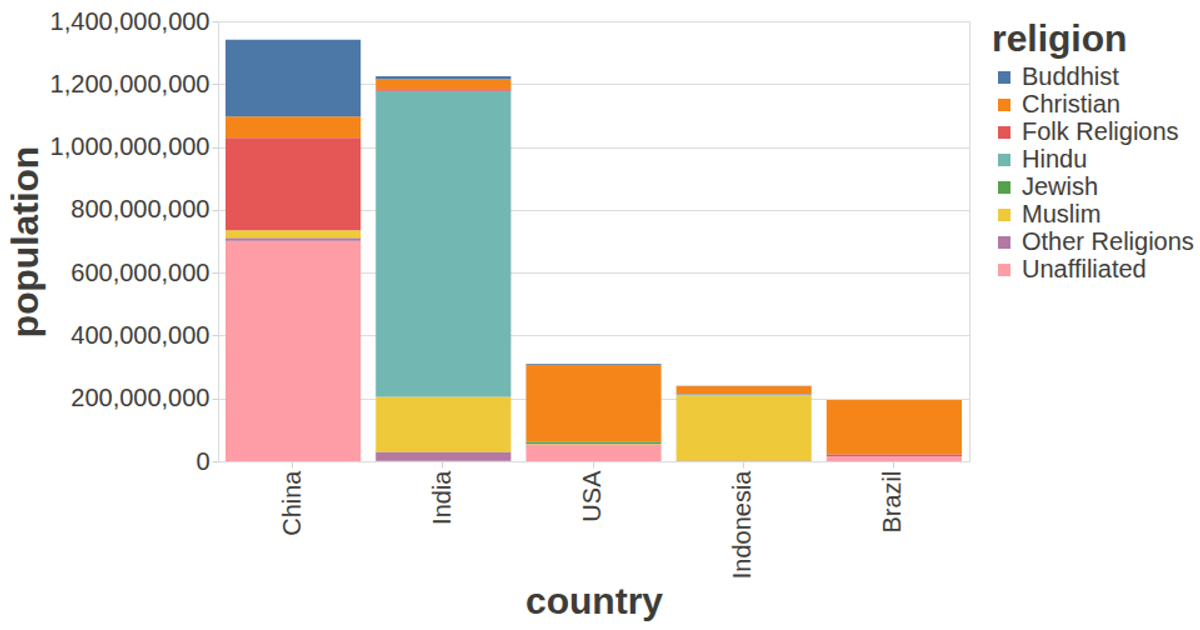
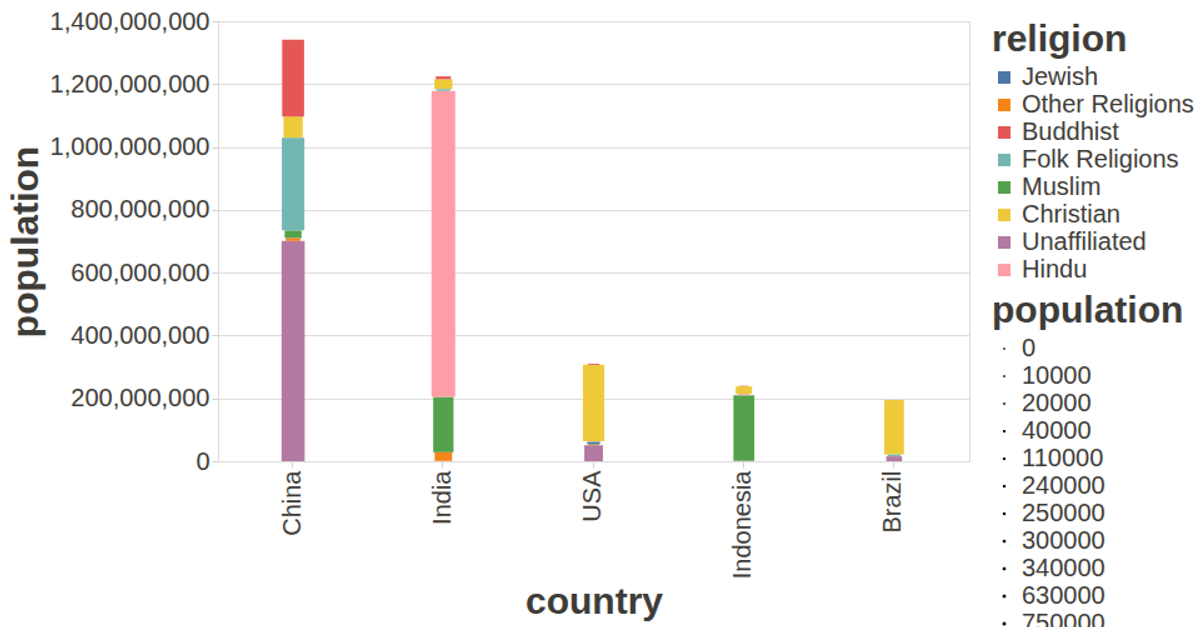
This example visualizes the top five religions by country, using circle size to encode population and positioning to map country and religion attributes. It leverages the Vega-Lite API to construct a scatterplot, with data fetched via D3’s `csv` loader. The visualization is rendered as an SVG through Vega, incorporating a custom config for styling and automatic chart sizing to fit the viewport.
AI-generated descriptionA visualization constructed using the vega-lite-api.
MIT Licensed




Comments
Sign in to join the discussion.