🌍 Public
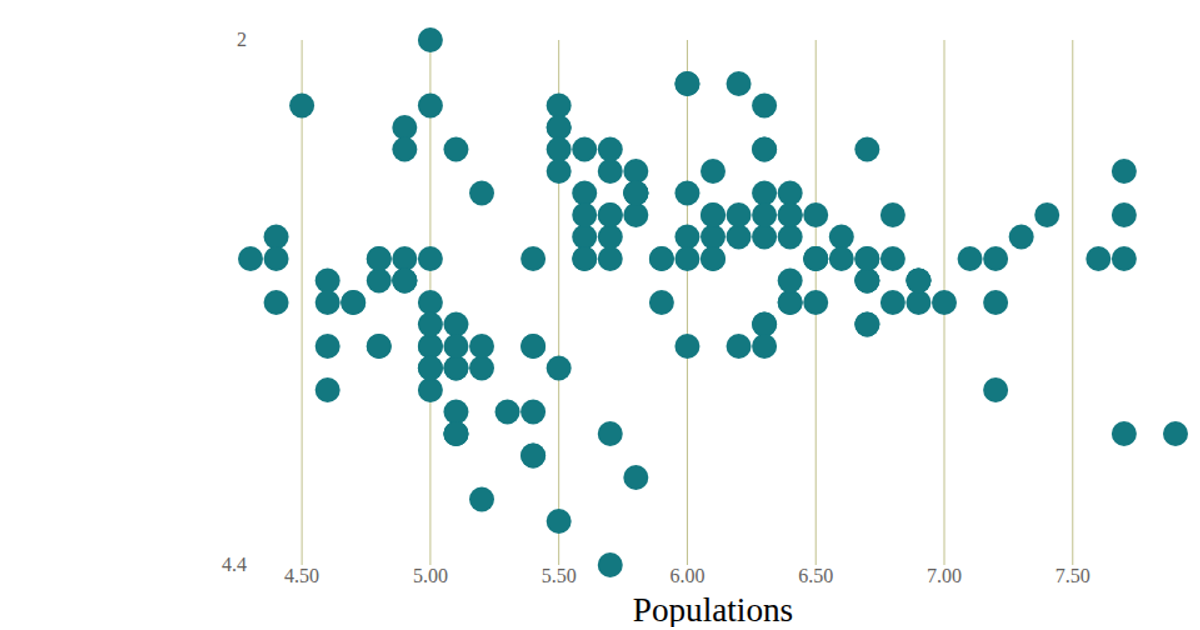
Aditya - test plot for scatter plot
This scatter plot visualizes Time against Value from the Iris Dataset, with each data point rendered as a circle. The React application uses D3’s `scaleLinear` and `extent` functions to map data to SVG coordinates, with axes drawn via custom `AxisBottom` and `AxisLeft` components. D3’s `line` function connects the points in a path, while a CSV file fetched with `csv` provides the data.
AI-generated descriptionA scatter plot of The Iris Dataset.
MIT Licensed



Comments
Sign in to join the discussion.