🌍 Public
Tutorial 3.2 Scatter Plot with Shape Aadesh
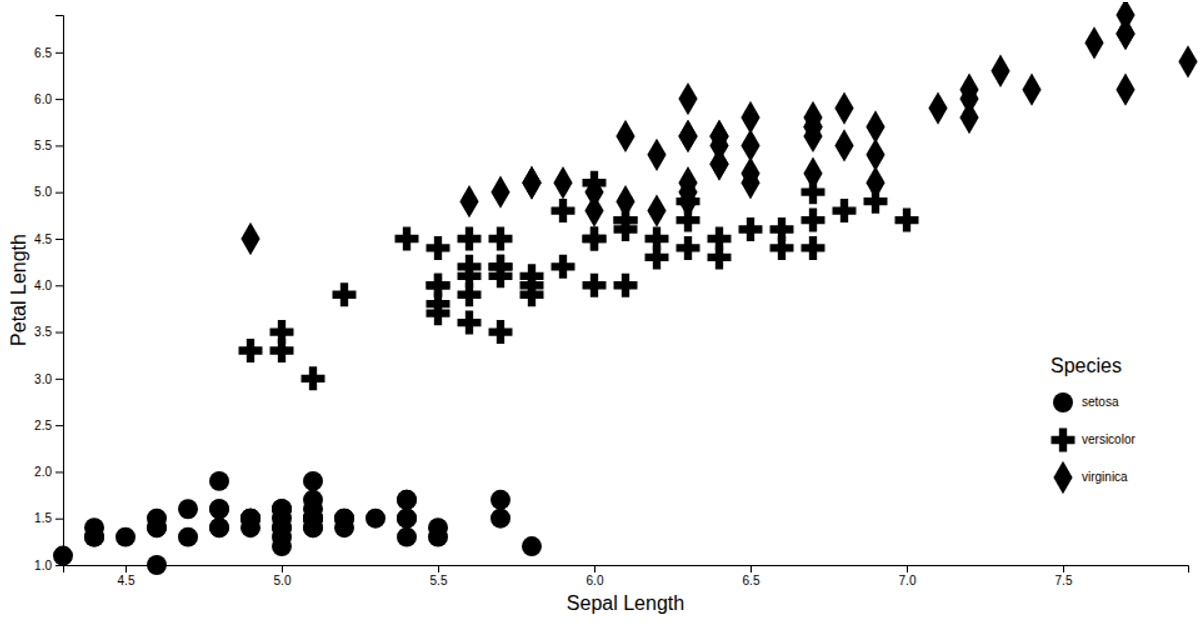
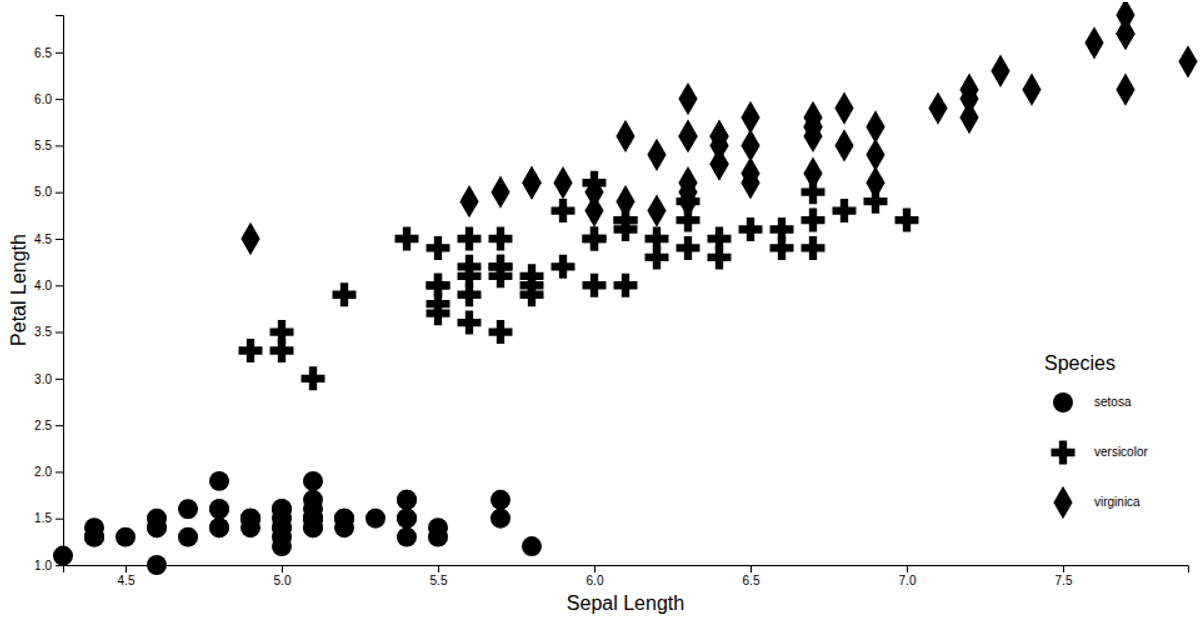
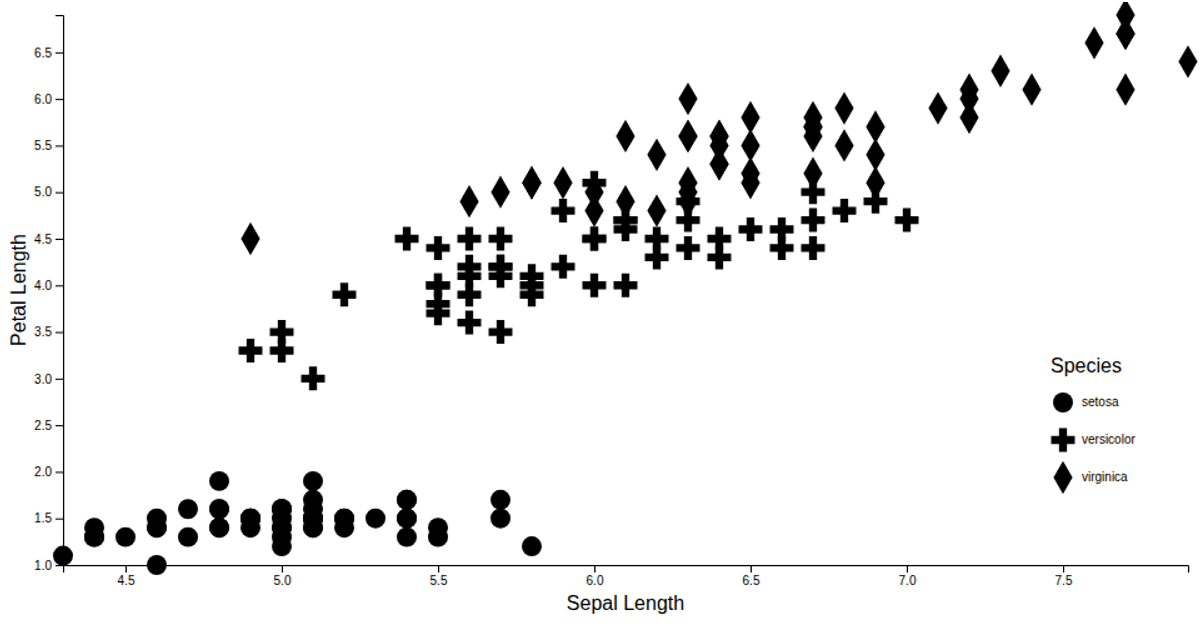
This scatter plot visualizes the Iris dataset, showing the relationship between sepal length and petal length for three species, distinguished by shape. The plot uses D3.js v7 with `scaleLinear` and `scaleOrdinal` to map data to positions and symbolic shapes from `symbolsFill`. A shape legend displays each species. Data is loaded from a remote CSV file and parsed with `csvParse`, with the axes and legend created using D3's `axisLeft`, `axisBottom`, and custom shape legend components.
AI-generated descriptionMIT Licensed




Comments
Sign in to join the discussion.