0 views in last 90 days
Yedrup
@Yedrup
French Front-End Developer !
Public vizzes

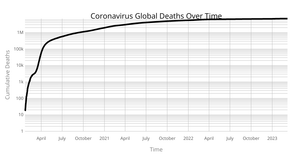
Fork of Coravirus Deaths Over Time by Country by Voronoi
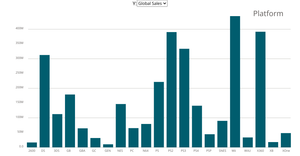
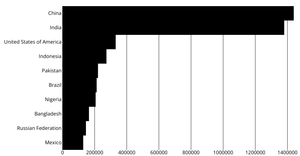
Fork of A Bar Chart(Platform)
Fork of Stylized Bar Chart
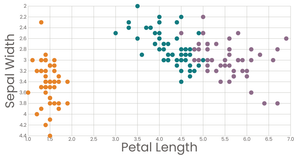
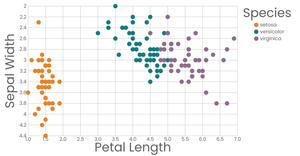
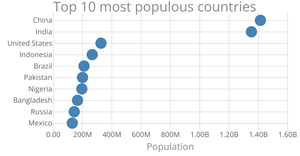
Fork of Scatter Plot with Color
Visualization labels
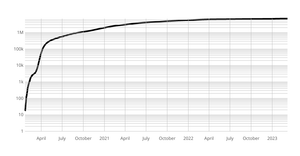
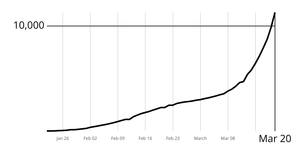
Coronavirus line chart - Log Scale
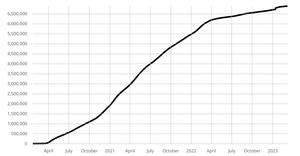
Coronavirus line chart - Linear Y Axis
Fork of Coronavirus Linear Y Axis
Coronavirus Line Chart with Log Scale and Labels
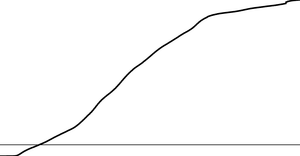
Coronavirus line chart - global deaths Axes useRef and D3
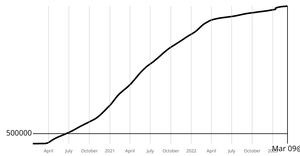
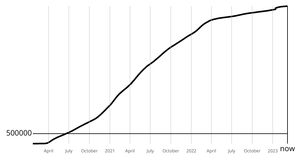
Coronavirus line chart - global deaths - marker line 500k
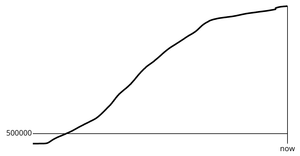
Coronavirus line chart - global deaths

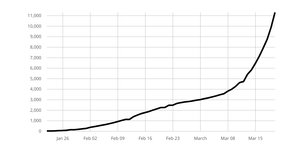
Coronavirus line chart

Summarizing coronavirus data

loading and parsing Coronavirus data
Fork of Stylized Line Chart
Fork of Interactive Color Legend

Fork of Polished Scatter Plot with Menus

Fork of Scatter Plot with Menus

Fork of Polished Scatter Plot with Menus
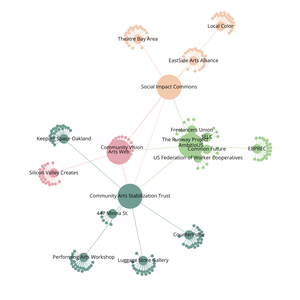
Fork of Organization Graph Diagram

Fork of Coronavirus Deaths Over Time by Country With Voronoi Overlay

Fork of Coronavirus Deaths Over Time by Country With Voronoi Overlay
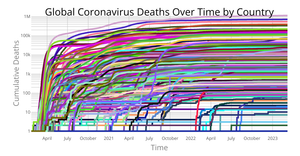
Fork of Coronavirus Deaths Over Time by Country
Fork of Global Coronavirus Deaths
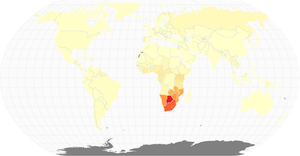
Fork of HIV/AIDS Choropleth Map
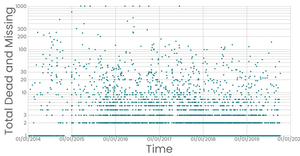
Fork of Missing Migrants Scatter Plot Log Scale

Fork of Migrant Deaths Linked Views with Fast Brushing
Fork of Multiple Views with Brushing

Fork of Multiple Views Cleanup
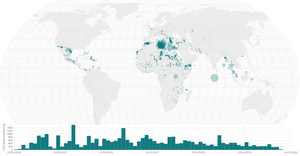
Fork of Missing Migrants Multiple Views
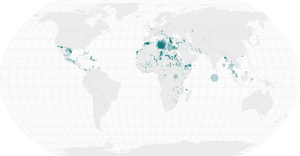
Fork of Missing Migrants on a Map
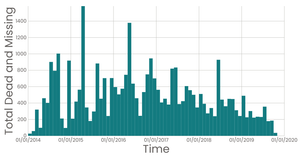
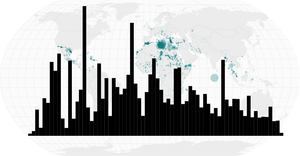
Fork of Missing Migrants Date Histogram
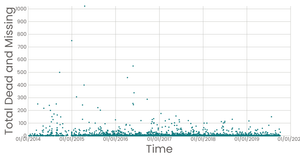
Fork of Missing Migrants Scatter Plot
Fork of Sized Points on a Map
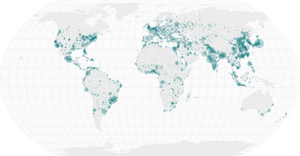
Fork of Points on a Map
Fork of Interactive Color Legend

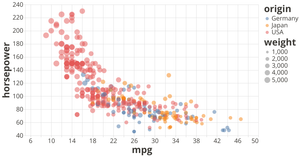
Fork of Scatter Plot with Color Legend
Fork of Menus with React
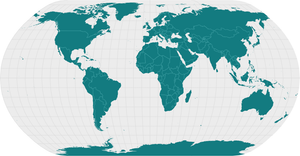
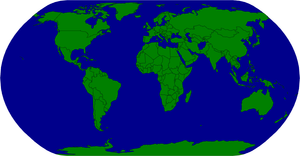
Fork of Polished World Map
Fork of Working with Time
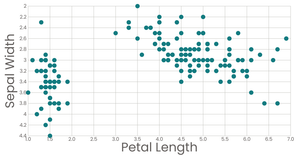
Fork of Stylized Scatter Plot

Fork of Refactored Bar Chart
Fork of Axes with React & D3

Fork of Pathetic Bar Chart

Fork of Rendering Data with React & D3
Fork of Vega-Lite API Template

Fork of Loading Data with React & D3

Fork of Mouse Follower

Fork of Loading and Parsing CSV Data

Fork of Smiley Face Part VI

Fork of Smiley Face Part V

Fork of Smiley Face Part IV

Fork of Smiley Face Part III

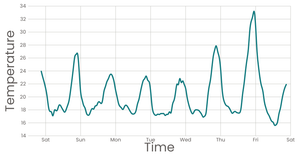
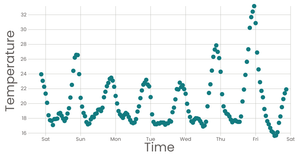
A week in San Francisco - Line chart

Multing Data for Multiple Lines

Selecting a year of a line chart

Line chart with Multiple Lines

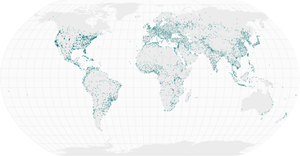
circles on the map

Scatter Plot with Menus

Cars Scatter Plot
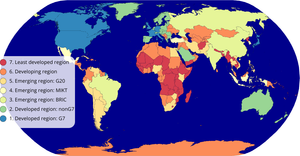
choropleph with interactive filtering

choropleph
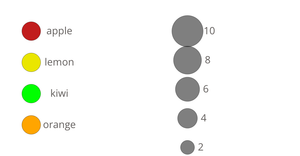
Color and size legend
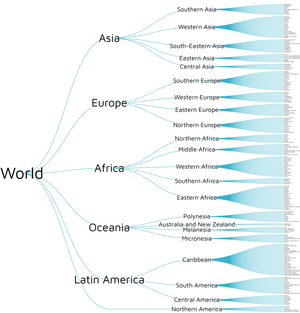
World countries tree

art tree

blank canvas
cheap tricks for interaction
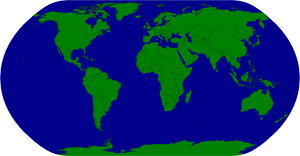
let s make a map with d3

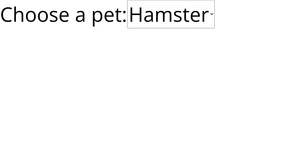
Bowl of fruits, hover to select

Bowl of fruits, click to select
Bowl of fruits, general update pattern

Bowl of fruits, general update pattern

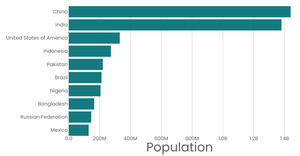
World Population Area Chart

A week in San Francisco - Area Charts

A week in San Francisco - Scatter plot
scatter plot
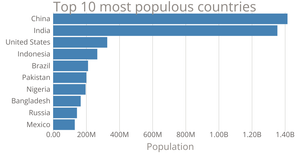
customization axis (Making a Bar Chart)
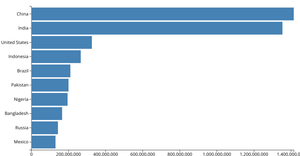
Making a Bar Chart

face with D3.js eyebrows moving

Let's make a face with D3.js
Shapes with SVG and CSS