🌍 Public
ICE 8 social Network graphic
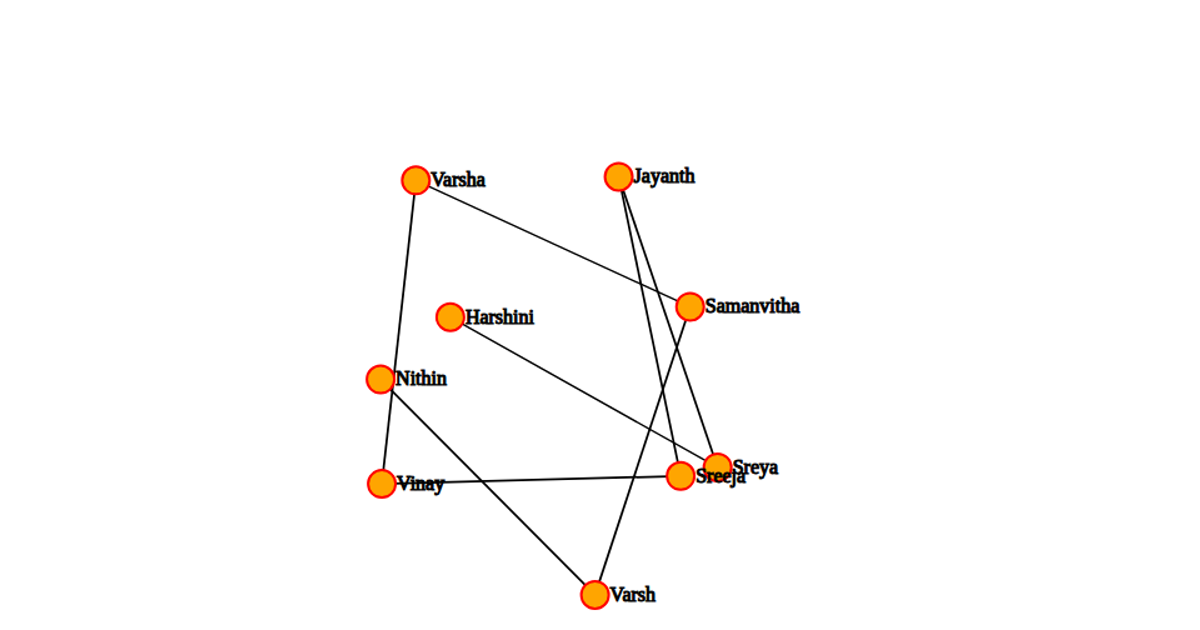
This force-directed network graphic maps a small social graph of seven named individuals, with node size and link thickness encoding relationship weight from a JSON file. Built using `d3.layout.force`, it applies gravity, charge, and distance parameters to position nodes, rendering them as orange SVG circles with labeled text and black links. Users can drag nodes interactively via `force.drag`, while the tick handler updates link coordinates and node transforms. The visualization highlights the connections between V.V.R Narsaiah and his network, using `Math.sqrt(d.weight)` for stroke-width to show stronger ties like the repeated Rocky links.
AI-generated descriptionMIT Licensed




Comments
Sign in to join the discussion.