The data shown here comes from
ans.csv.
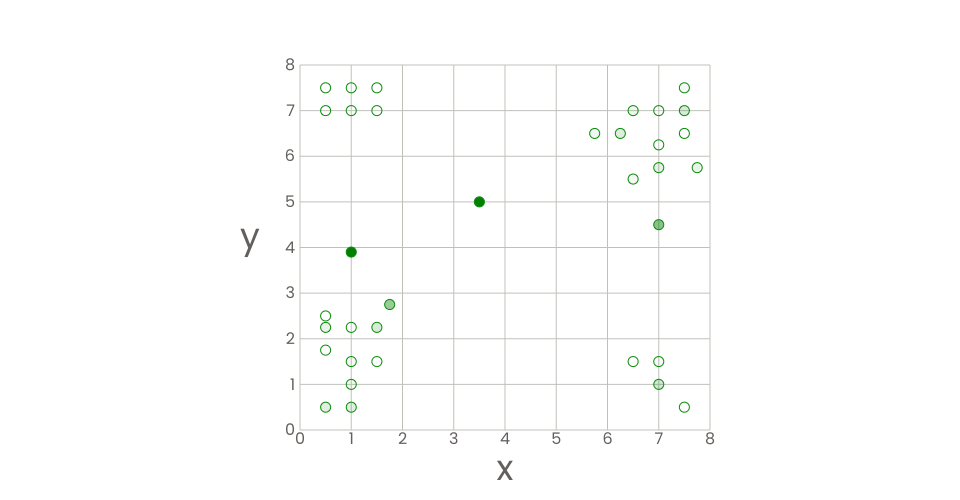
This visualization has tooltip function, so be sure to hover over each point ;)
The opacity of each point depends on it's LOF value, i.e. the higher LOF value is, the darker the point is, which means the more "outlier" this point is.