🌍 Public
Stylized Bar Chart
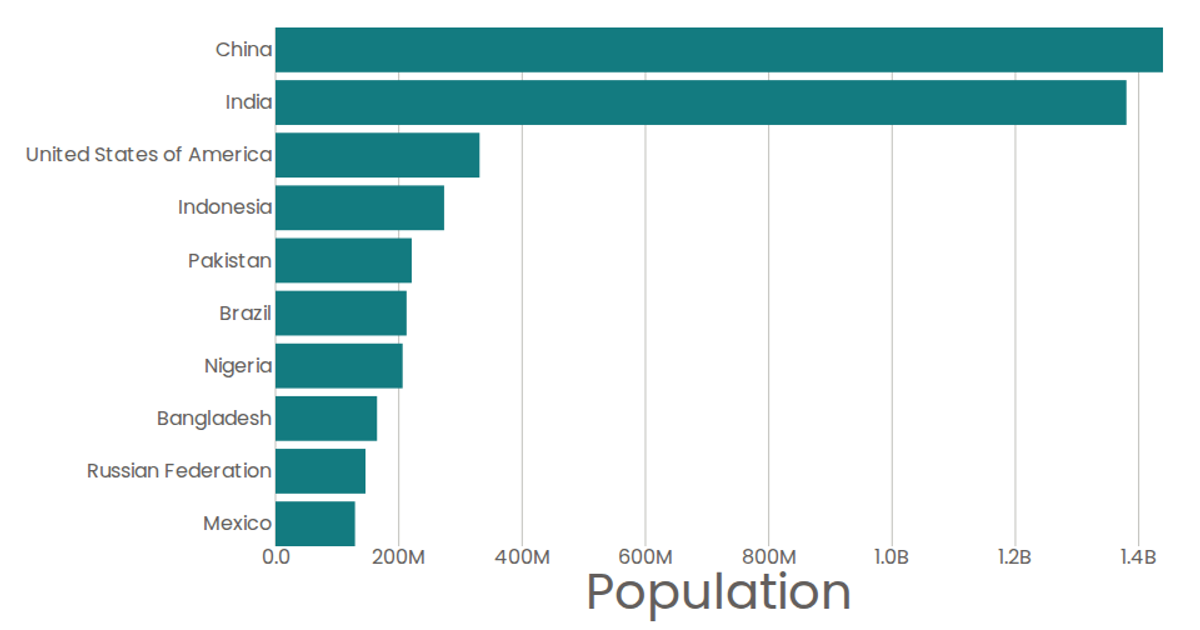
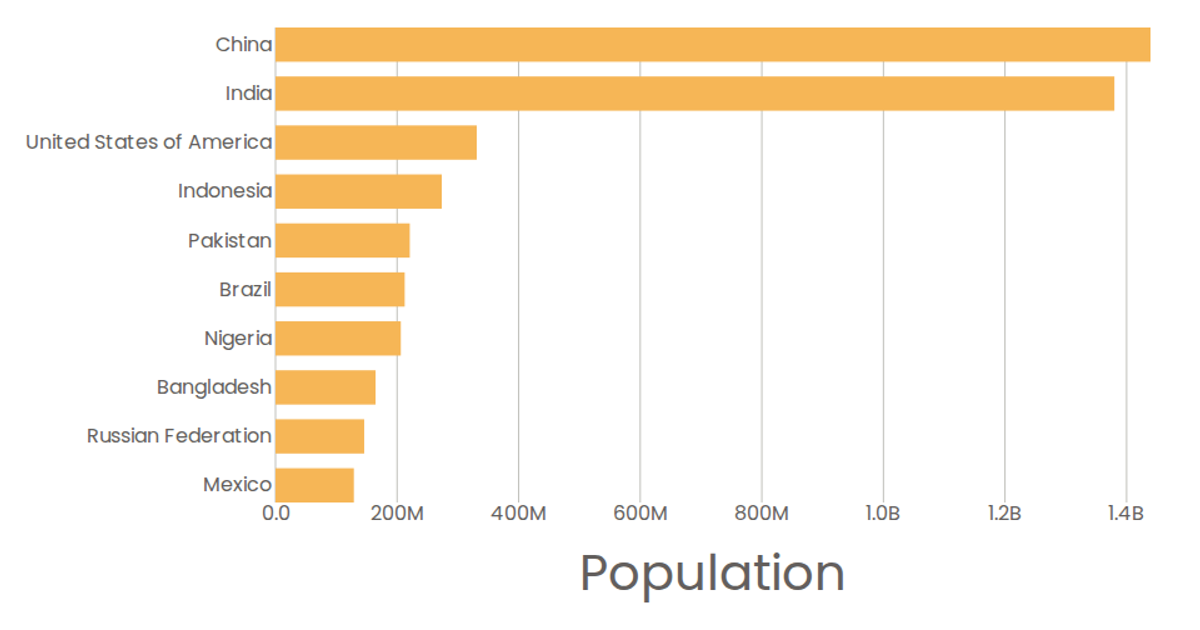
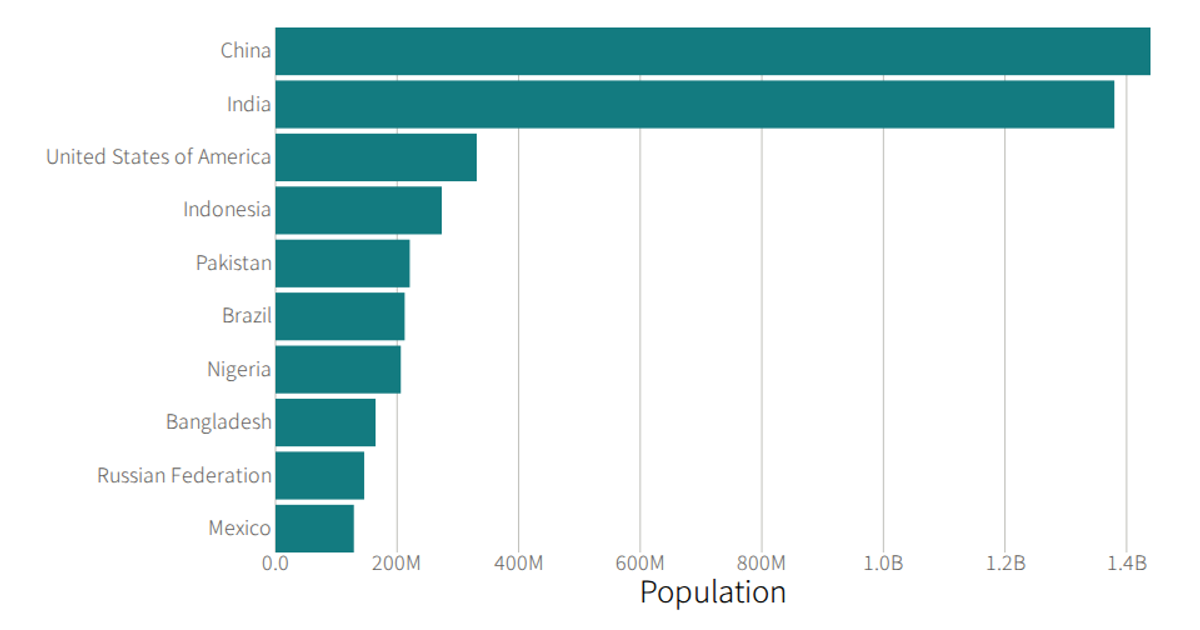
This stylized bar chart displays the top 10 most populous countries in 2020, sorted alphabetically, with a vibrant orange fill and large typography. Built with React and D3 v5, it uses `scaleBand` and `scaleLinear` to map country names and population values to SVG rectangles. The data comes from a UN Population CSV file loaded via D3’s `csv` utility. Custom tick formatting converts values to billions, and axes are rendered as separate React components.
AI-generated descriptionA program that loads in some data about country populations using D3 utilities, and uses React to render the data as a bar chart.
MIT Licensed



Comments
Sign in to join the discussion.