🌍 Public
Let's make a customizing axis Bar Graph with D3.js
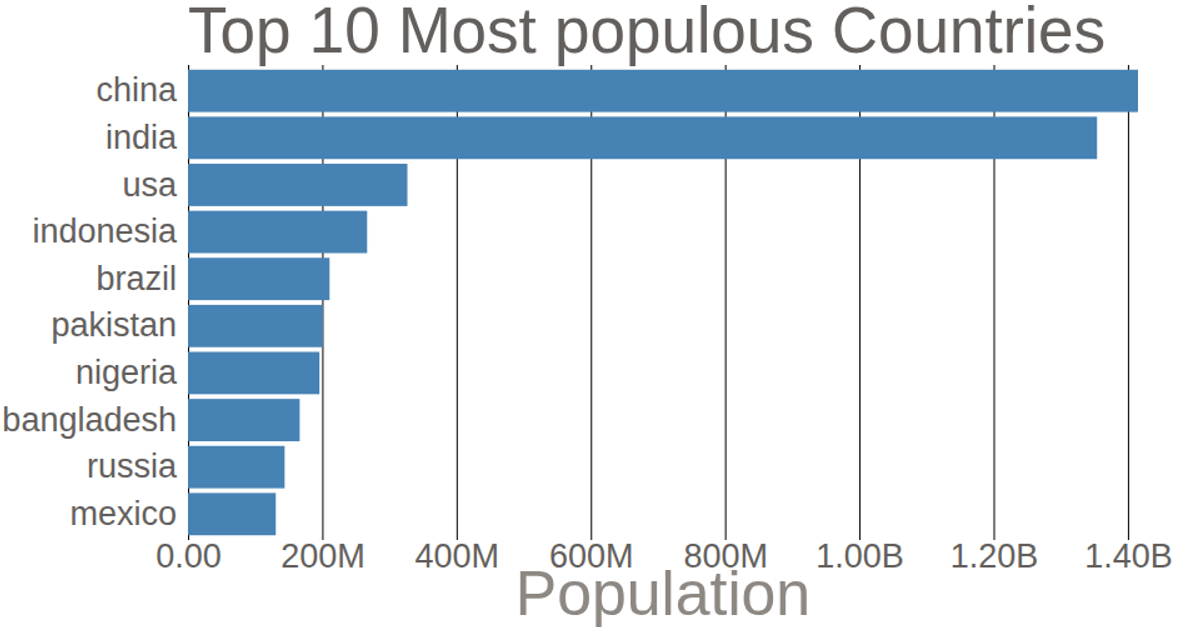
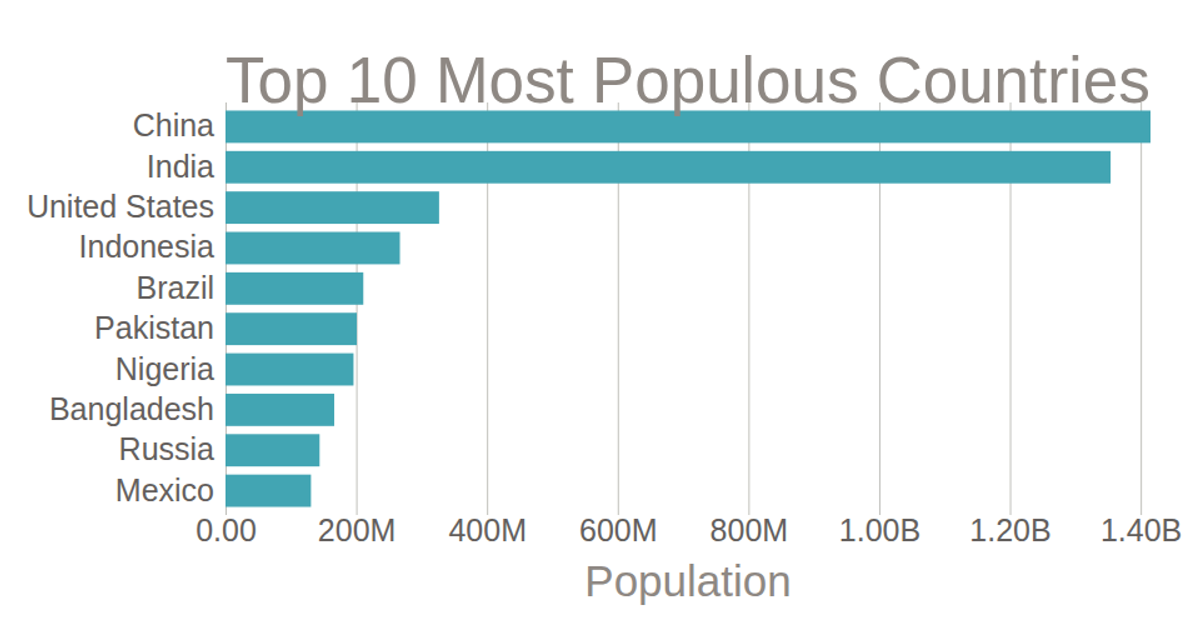
This bar chart displays the population of the top 10 most populous countries, with horizontal bars ranked from China to Mexico. The visualization uses D3.js v7 with SVG rendering. The code employs `d3.scaleLinear` for the x-axis, `d3.scaleBand` for the y-axis, and `d3.axisLeft` and `d3.axisBottom` to generate customized axes with removed domains and tick lines. Population values from a CSV file are multiplied by 1000 and formatted using `d3.format`.
AI-generated descriptionMIT Licensed




Comments
Sign in to join the discussion.