🌍 Public
Fork of SVG Practice Sheet. step two
SStephenM-Data
Last edited Nov 27, 2023
Created on Nov 27, 2023
Forked from SVG Practice Sheet. Note: browser Tab text
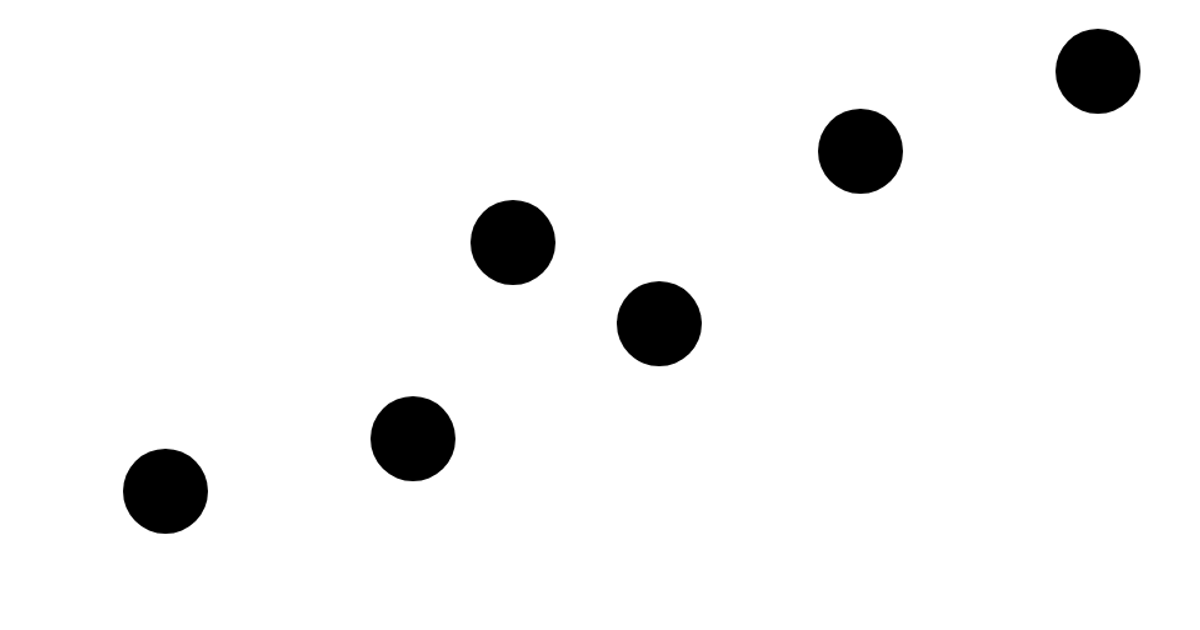
This example is an SVG practice sheet showing a scatter plot inside a large bordered frame. It demonstrates the use of the SVG `circle` element to plot various data points at different coordinates, each with a fixed radius and black fill. The chart is drawn using plain SVG markup within an HTML document, without any JavaScript libraries. A small rounded rectangle in the top-left corner, outlined with a subtle black stroke, functions as a label or annotation box. The overall layout emphasizes SVG coordinate positioning and basic shape rendering for static data visualization.
AI-generated descriptionSVG learning doc. Scatter Plot from Figma - practice
MIT Licensed





Comments
Sign in to join the discussion.