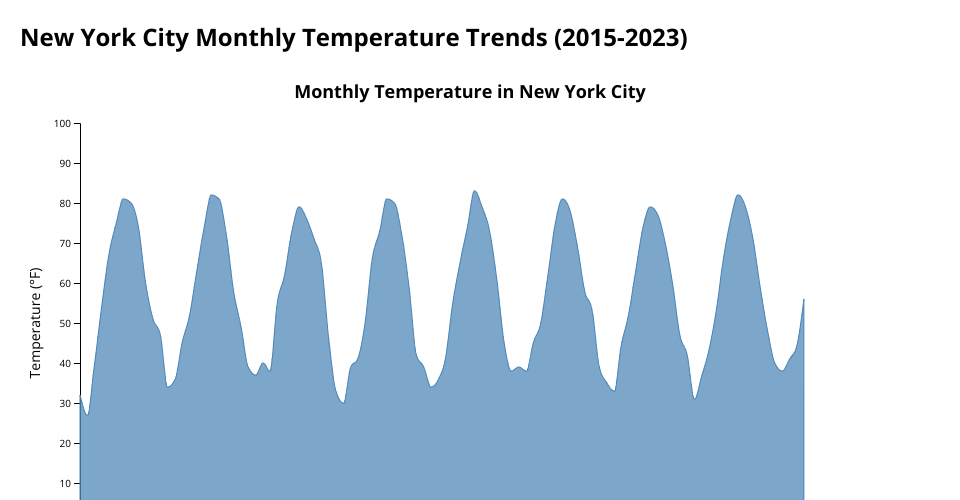
New York City Temperature Area Chart (2015-2023) - D3.js visualization of monthly temperature patterns showing seasonal trends.
MIT Licensed
New York City Temperature Area Chart (2015-2023) - D3.js visualization of monthly temperature patterns showing seasonal trends.