🌍 Public
Activity-8 Q1.1
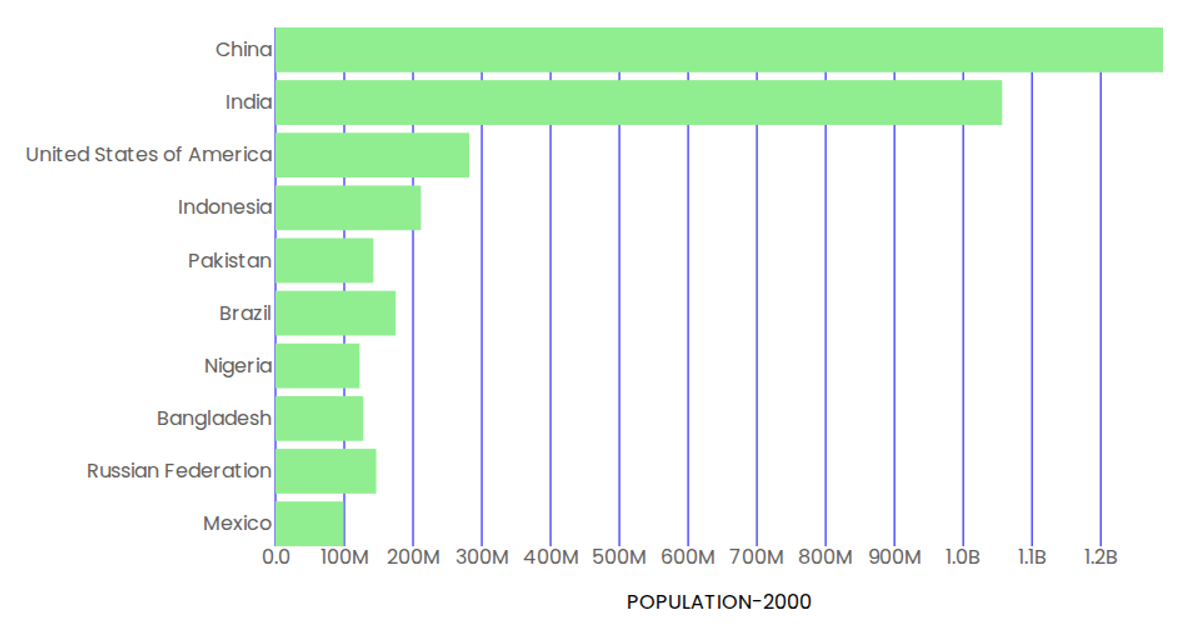
This example displays a horizontal bar chart of the populations of ten countries in the year 2000, using a green fill for each rectangular bar. Built with React and D3 v5, it renders as an SVG and loads data from a remote CSV file. The chart employs `scaleBand` for the vertical country axis and `scaleLinear` for the population scale, with axes generated using custom `AxisBottom` and `AxisLeft` components.
AI-generated descriptionAn example showing the capabilities of VizHub:
- Loads D3 via UNPKG.
- Demonstrates use of
importfrom"d3". - Demonstrates use of
importfrom local ES6 modules.
MIT Licensed




Comments
Sign in to join the discussion.