🌍 Public
Fork of Pie chart Test
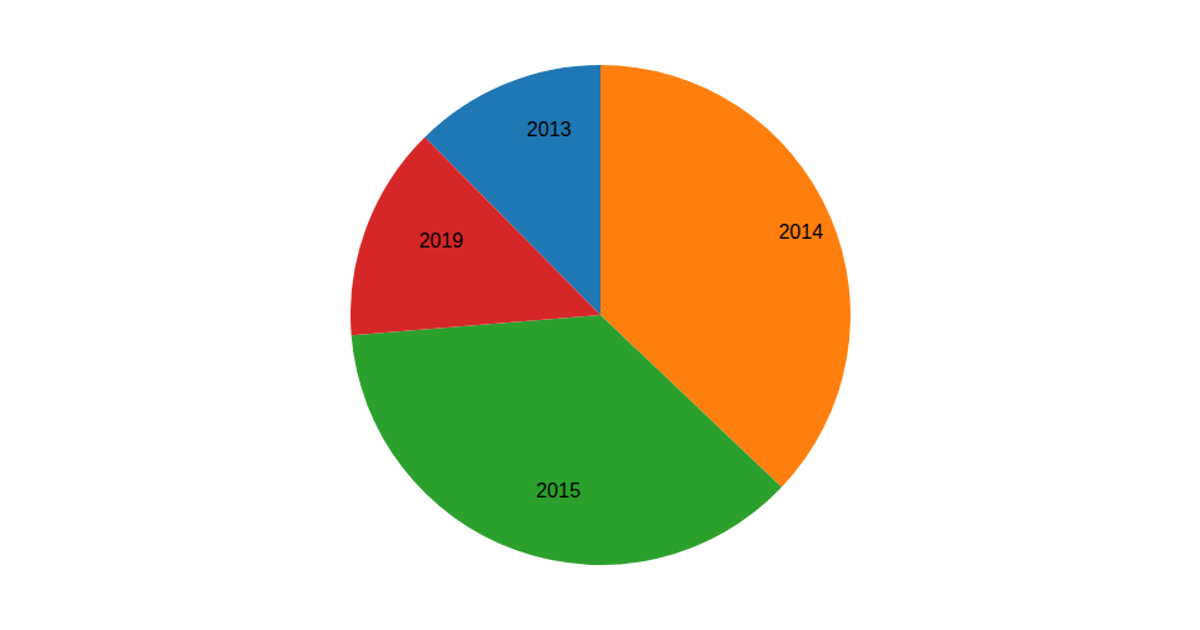
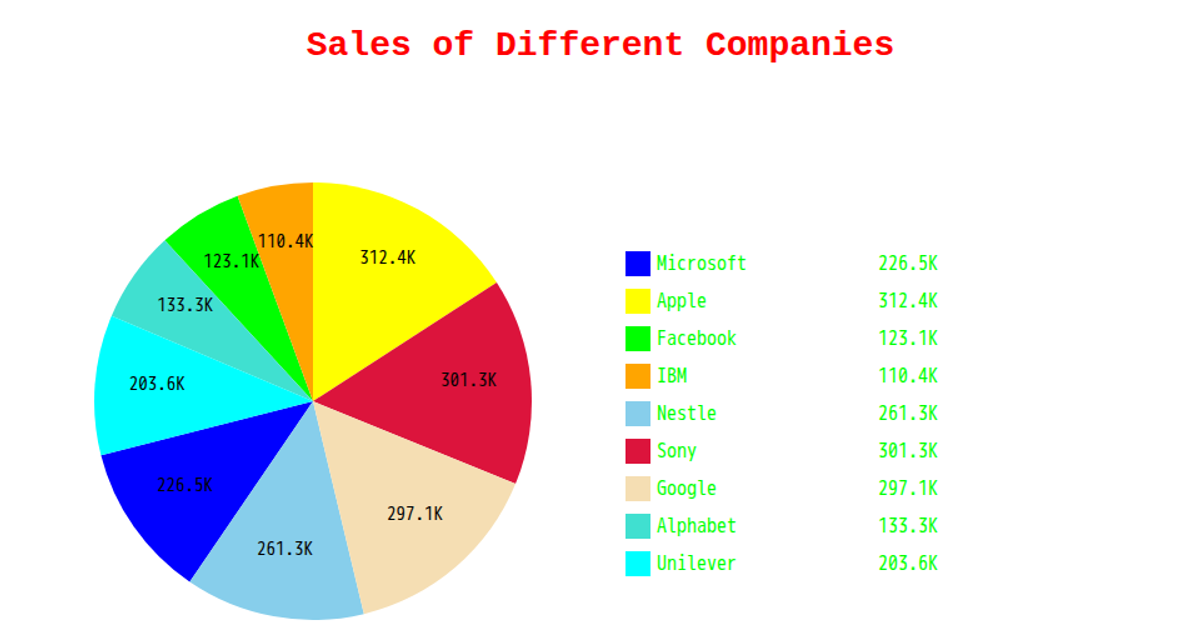
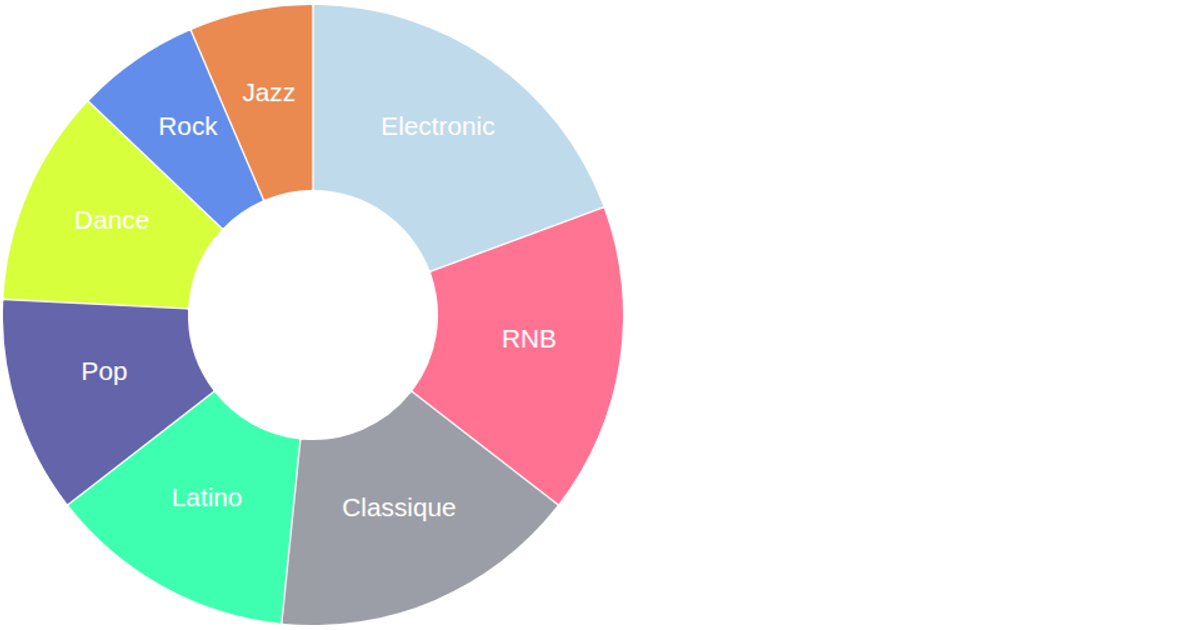
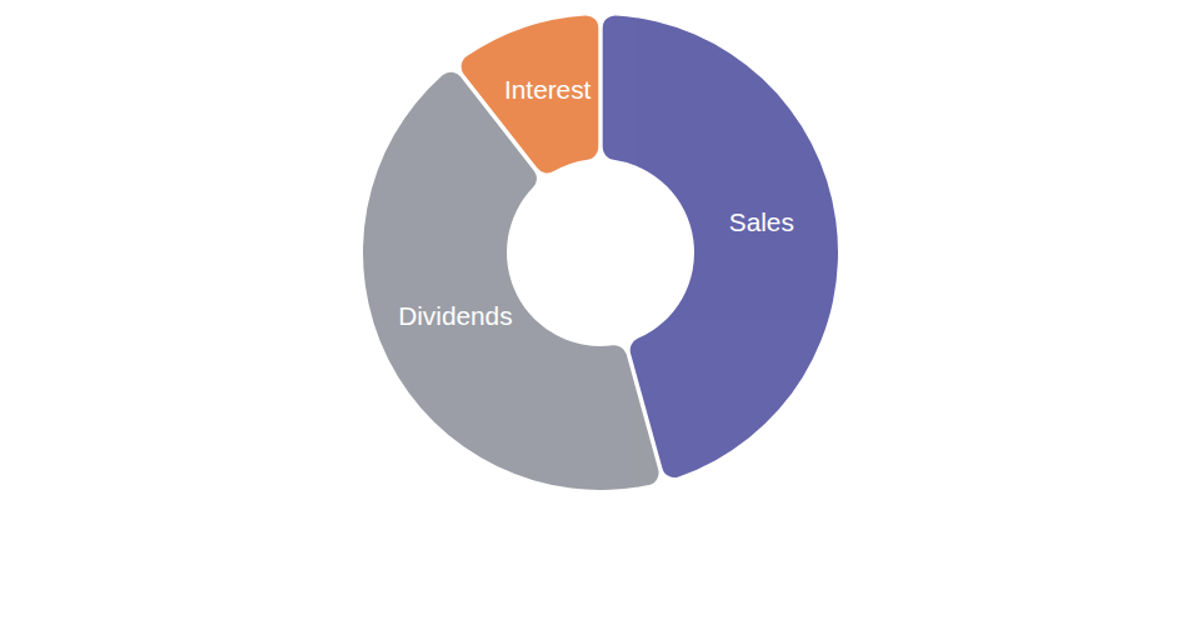
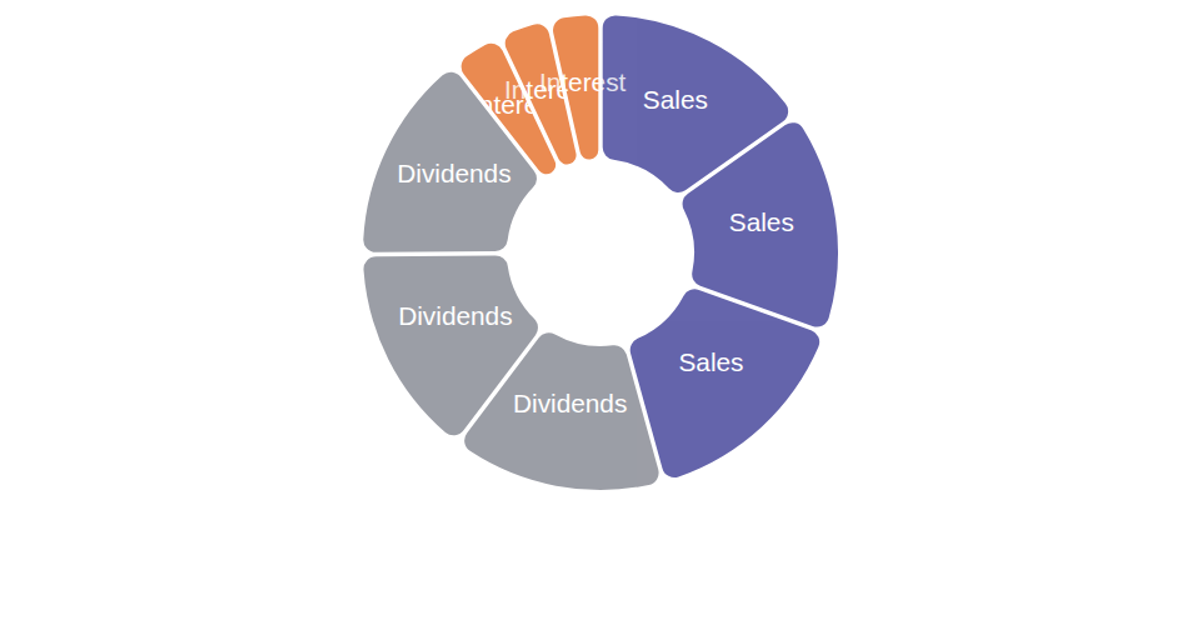
This example presents a large donut chart that displays the revenue figures of ten major global companies, drawn from a CSV data file. The chart is rendered as Scalable Vector Graphics (SVG) using the D3.js library, with each segment’s color assigned from a hardcoded ordinal scale. The visualization’s construction relies on the `d3.pie` function to compute the arc segments, `d3.arc` to define the donut’s inner and outer radii, and centroid-based text positioning to place company names. The code also includes a default dataset and static functions, indicating a direct, non-interactive rendering approach.
AI-generated descriptionMIT Licensed



Comments
Sign in to join the discussion.