🌍 Public
Fork of ICE 7 Area Chart
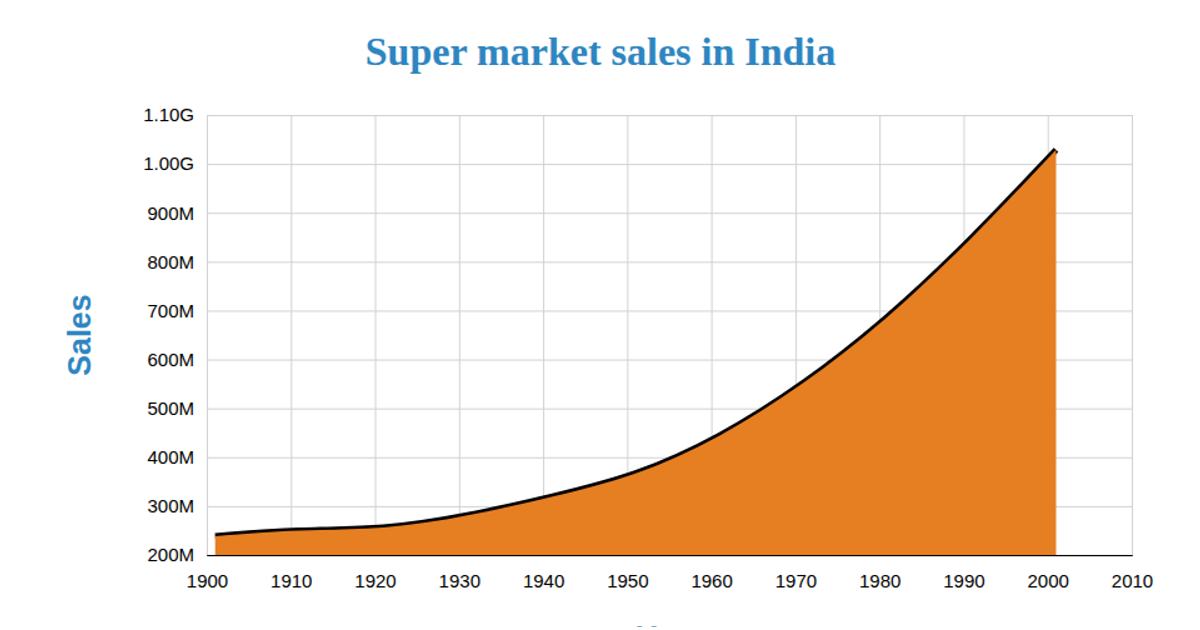
This area chart visualizes Domino’s sales in India from 2009 to 2019, with a filled region and overlaid line showing sales growth over time. Built with D3 v7, it uses `d3.area()` and `d3.line()` with a monotone X curve, while `d3.scaleTime()` and `d3.scaleLinear()` map dates and sales values. The SVG rendering includes a grid, axes, and labeled y-axis, with data loaded from a CSV file hosted on GitHub. The chart emphasizes trend clarity through a semi-transparent steelblue fill and a bold stroke.
AI-generated descriptionimplementing area chart
MIT Licensed




Comments
Sign in to join the discussion.