🌍 Public
Activity-7Q1
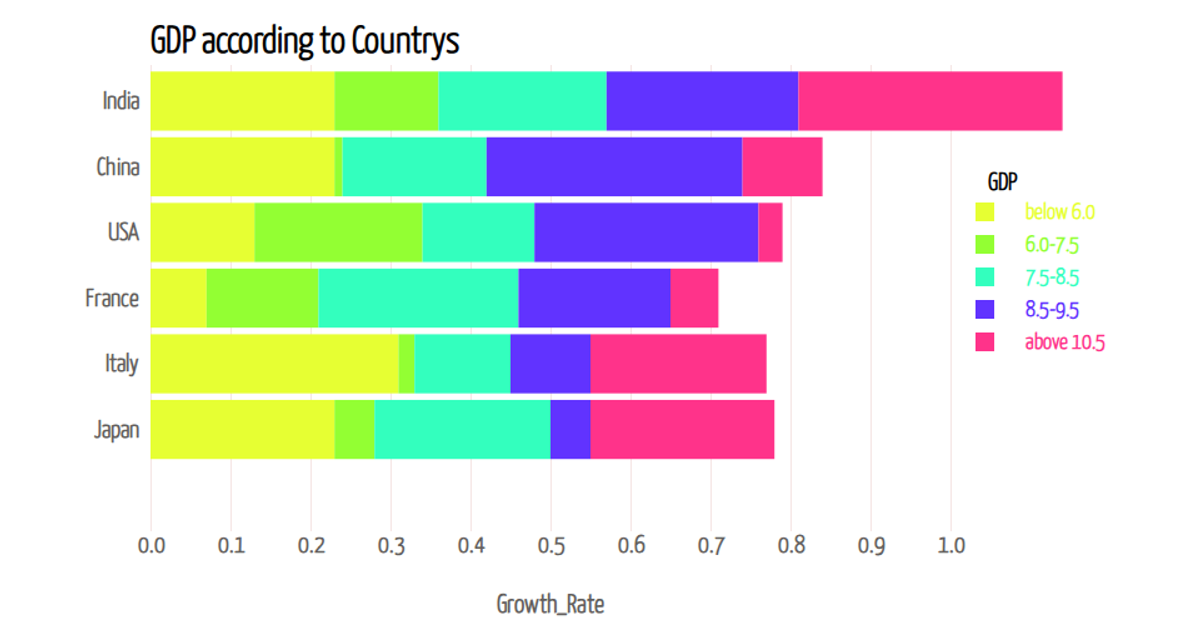
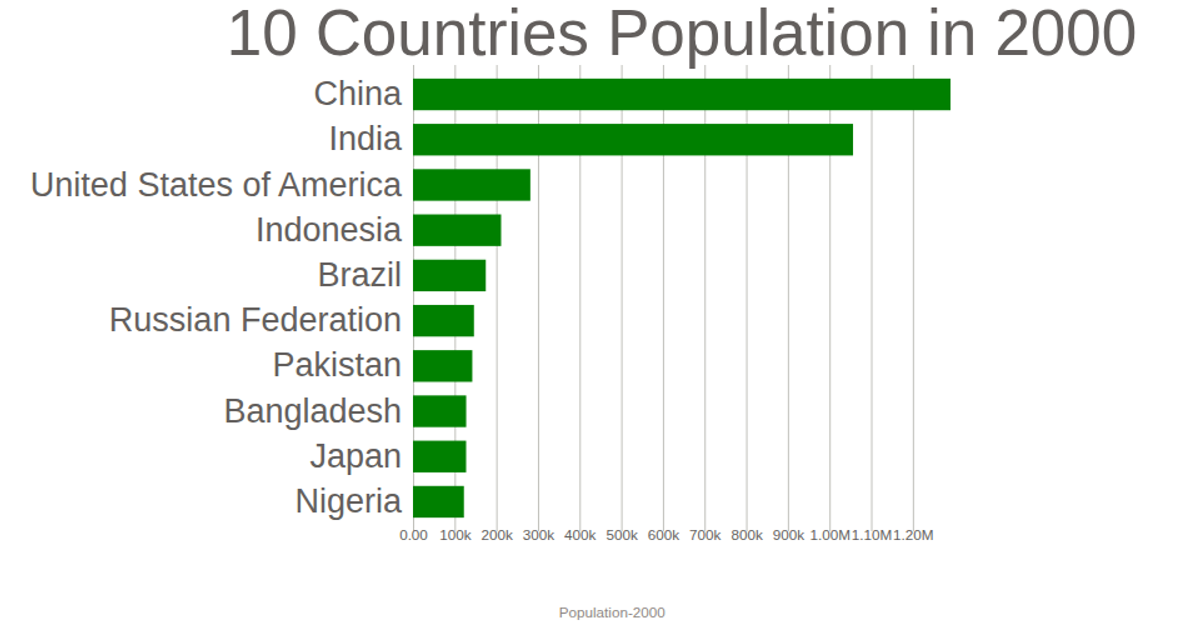
This visualization displays World Bank data for the most recent year in the dataset, using horizontal bars to compare GDP across countries. The chart renders as an SVG using D3 v7, with a linear scale for GDP values and a band scale for country names. It loads CSV data asynchronously via `d3.csv`, filters for the latest year using `d3.max`, and draws axes with `d3.axisBottom` and `d3.axisLeft`. Bars are colored teal and sized by GDP, with tick formatting applied via `d3.format`.
AI-generated descriptionMIT Licensed




Comments
Sign in to join the discussion.