🌍 Public
Fork of Hello VizHub
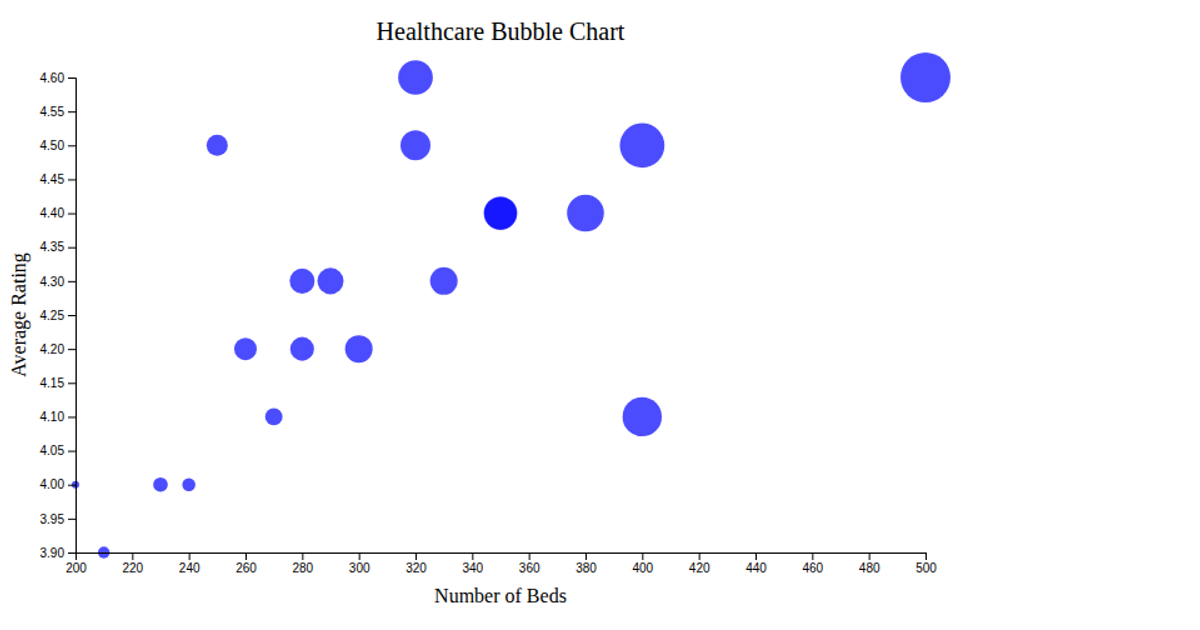
This interactive bubble chart visualizes the relationship between incidence and prevalence rates for fifteen medical diseases. Each bubble represents a disease, with its horizontal position indicating incidence rate and vertical position indicating prevalence rate per 100,000 individuals. Bubble size corresponds to the average age at diagnosis, allowing viewers to compare epidemiological metrics across conditions. Built with Chart.js, the visualization uses canvas rendering to display colored, semi-transparent bubbles with axis labels and tooltips. The chart is constructed from hardcoded disease data, drawing from the provided dataset to create an informative comparison of disease burden across common health conditions.
AI-generated descriptionMIT Licensed






Comments
Sign in to join the discussion.