🌍 Public
scatter-plot-color-legend
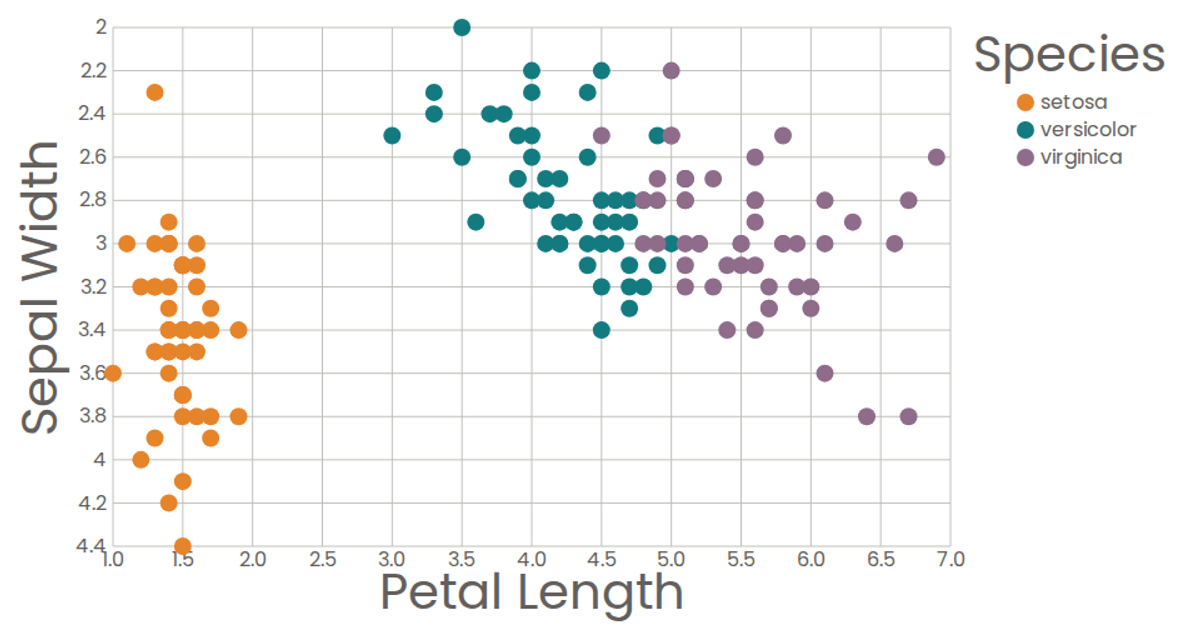
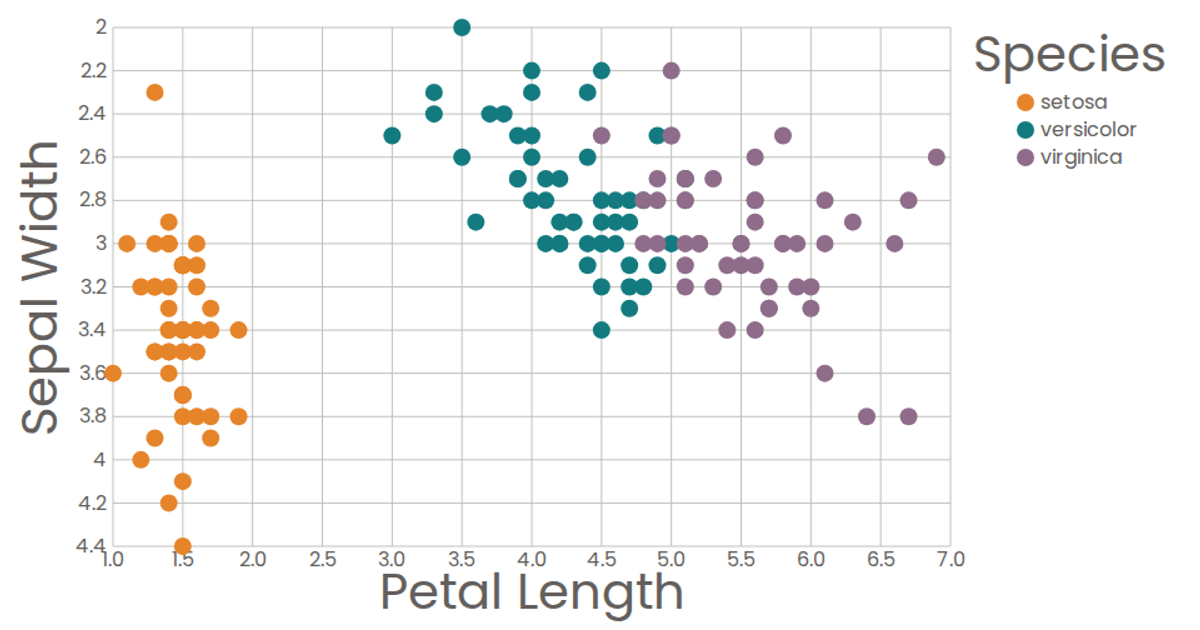
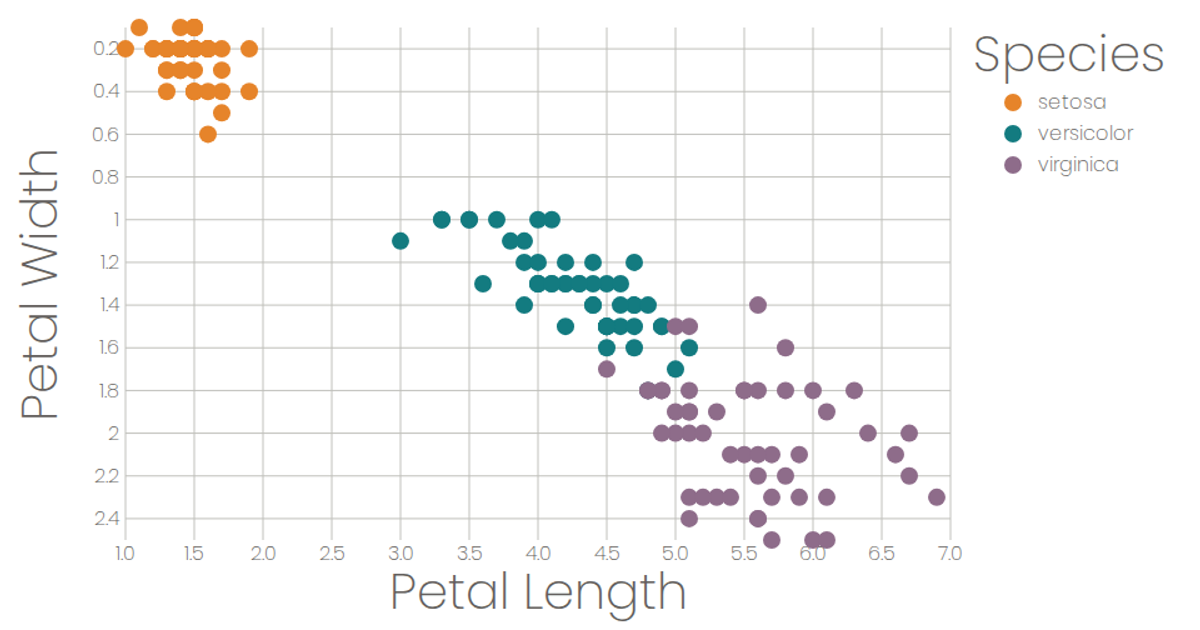
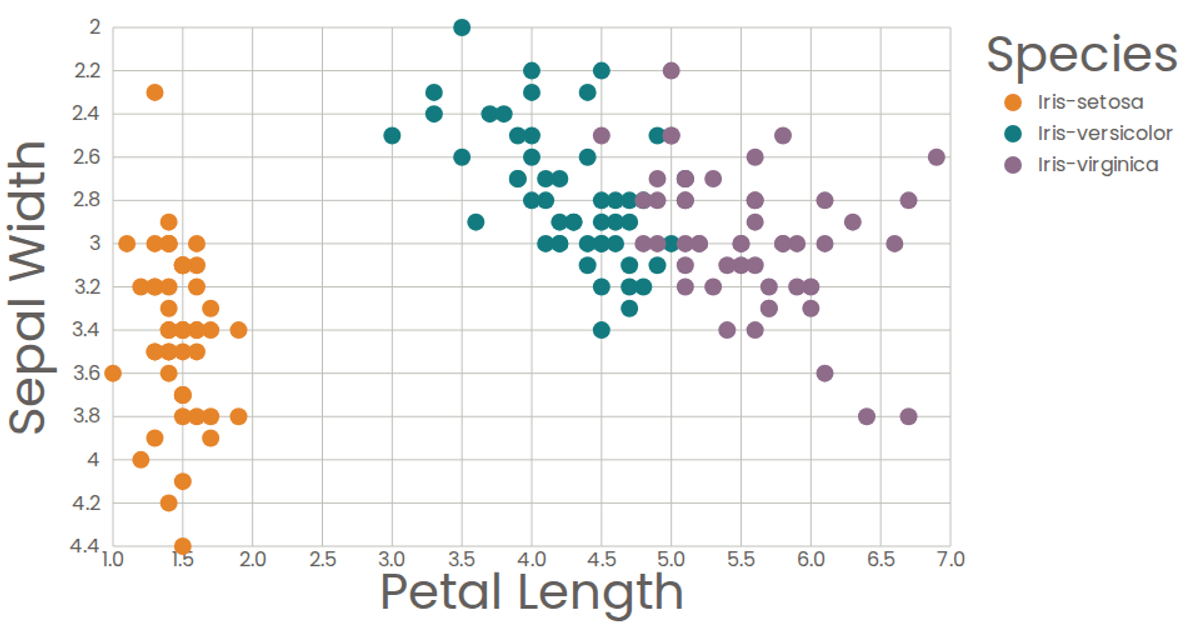
This scatter plot visualizes the Iris Dataset, showing the relationship between petal length and petal width. Circles represent individual flowers, colored by species using a categorical color scale (d3.scaleOrdinal with schemeCategory10). A legend highlights a species on hover by dimming other categories, with axis labels and tick marks rendered via d3.axisLeft and d3.axisBottom. The visualization loads data from a CSV file using d3.csvParse and updates reactively through a state management pattern with setState.
AI-generated descriptionLoading a CSV file, the Iris Dataset.
MIT Licensed




Comments
Sign in to join the discussion.