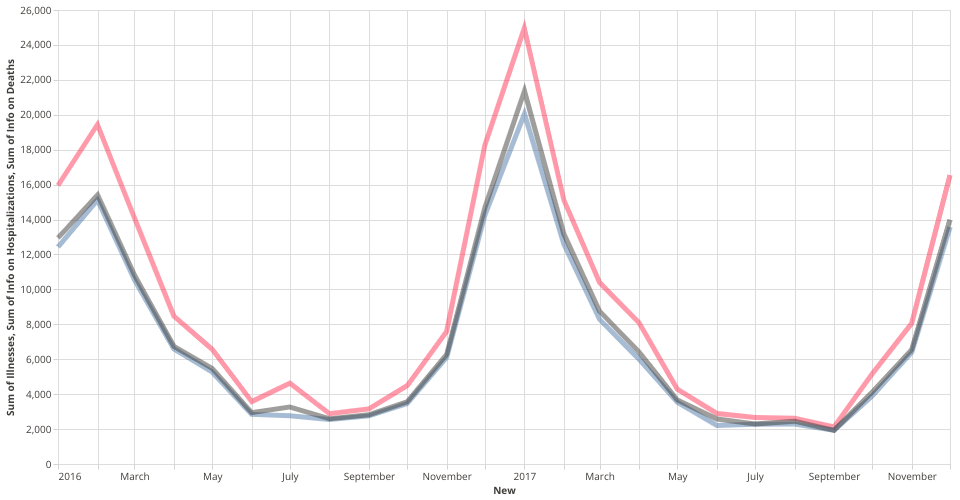
Task:1. Does the outbreak have the seasonality? Which months have highest frequency?
Answer: Yes, it does. The outbreak has high frequency in winter and reaches the bottom in summer.
Description of experience:
This time-series line plot shows the number of Illnessses, Hospitalizations and Deaths. At first I cleaned the data by concatenating "Year" and "Month" as timestamp. Second, I set layers in VegaLite API to draw multiple lines. And then modified them to make it better.
Interaction:
When mouse moves to the line, it will show the corresponding value at the point.
MIT Licensed