index.js
import {
select,
csv,
scaleLinear,
scaleBand,
max,
axisLeft,
axisBottom
} from 'd3';
const svg=select("svg");
const width=960;
const height=450;
const render=data => {
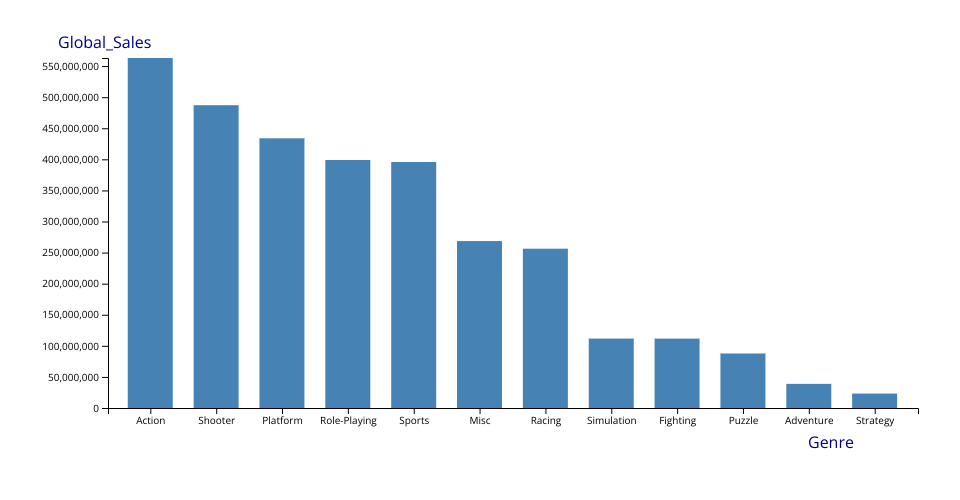
const xValue = d=>d.Genre;
const yValue = d=>d.Global_Sales;
const margin = {top:50, right:50, bottom:50, left:100};
const innerWidth = width-margin.left-margin.right;
const innerHeight = height-margin.top-margin.bottom;
const xScale = scaleBand()
.domain(data.map(xValue))
.range([0,innerWidth])
.padding(0.3);
const yScale = scaleLinear()
.domain([max(data,yValue),0])
.range([0,innerHeight]);
const g = svg.append("g")
.attr("transform",`translate(${margin.left},${margin.top})`);
const xAxis = g.append("g")
.call(axisBottom(xScale))
.attr("transform",`translate(0,${innerHeight})`)