🌍 Public
Read in JSON department files
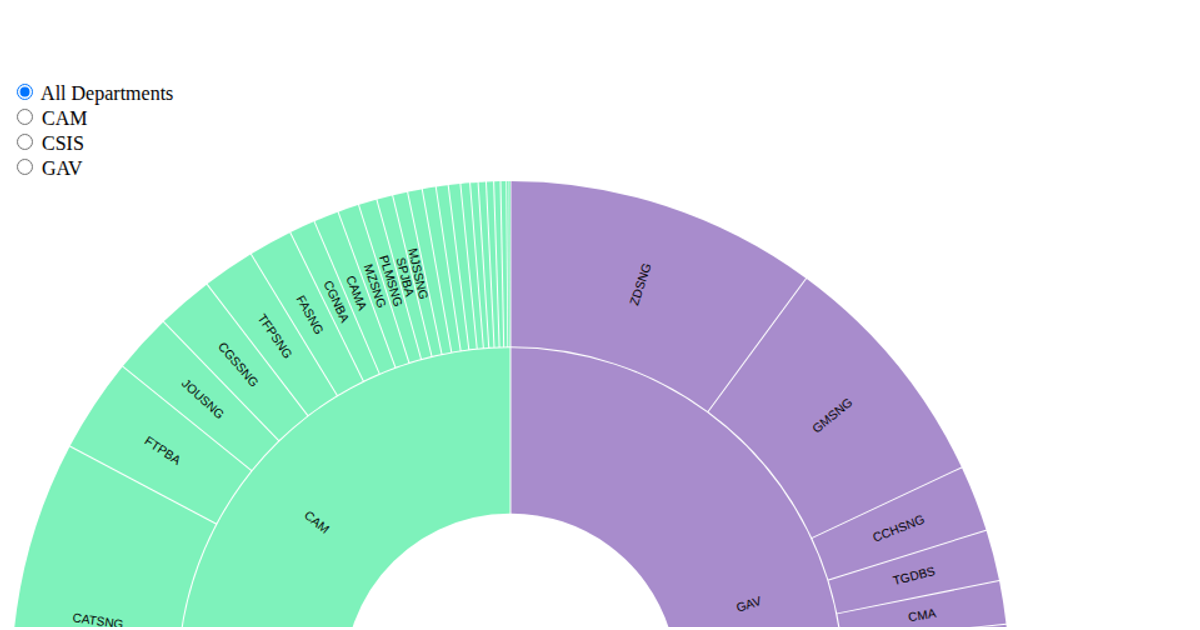
This interactive sunburst chart visualizes university enrollment data, showing student numbers (male and female) across different departments, courses, and modules. The hierarchical radial layout allows users to click on a department segment to zoom in and explore its specific course and module breakdowns. The visualization is built with D3.js v5, using the `d3.hierarchy`, `d3.partition`, and `d3.arc` APIs to construct and render the radial diagram. The code loads JSON data from three separate files—department names, pathways to departments, and course modules—and uses a promise-based `Promise.all` to load them asynchronously before constructing the hierarchy.
AI-generated descriptionMIT Licensed




Comments
Sign in to join the discussion.