🌍 Public
Fork of Scatter Plot with Menus
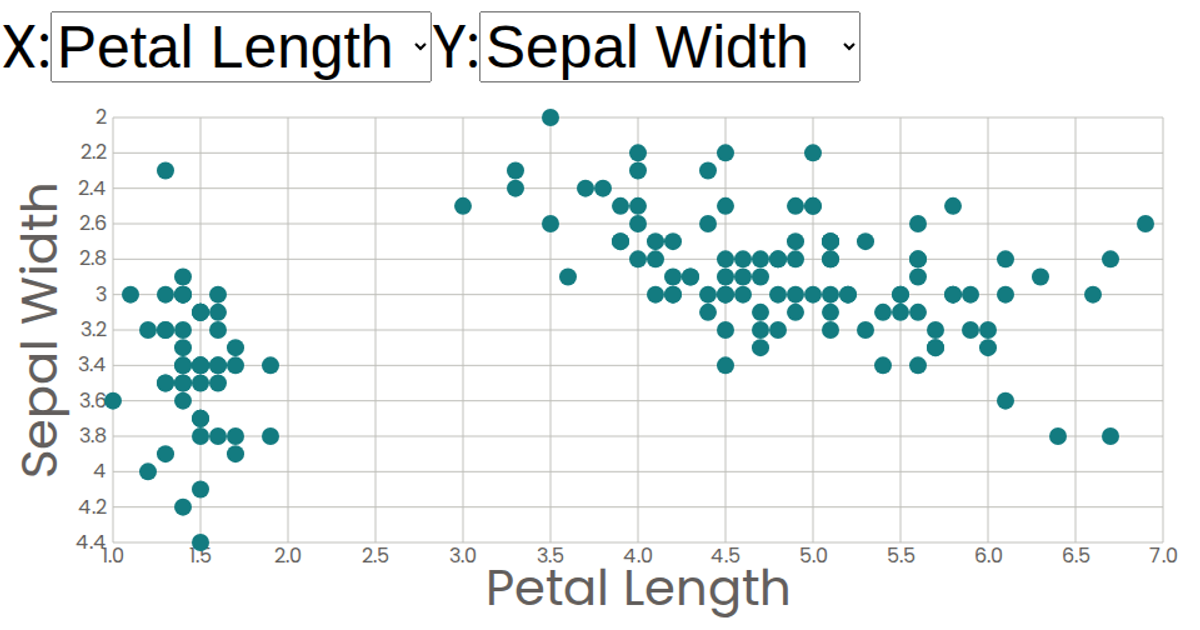
A scatter plot of the Iris dataset allows interactive selection of which measurement attributes (sepal length, sepal width, petal length, petal width, or species) appear on the X and Y axes via dropdown menus. The visualization is rendered as an SVG using React, with D3.js v5 functions like `csv` for data loading and `scaleLinear` for axis scales. Two dropdown components update the selected attributes, triggering re-renders of the axes and circles.
AI-generated descriptionA scatter plot of The Iris Dataset.
MIT Licensed




Comments
Sign in to join the discussion.