🌍 Public
Line Chart 2
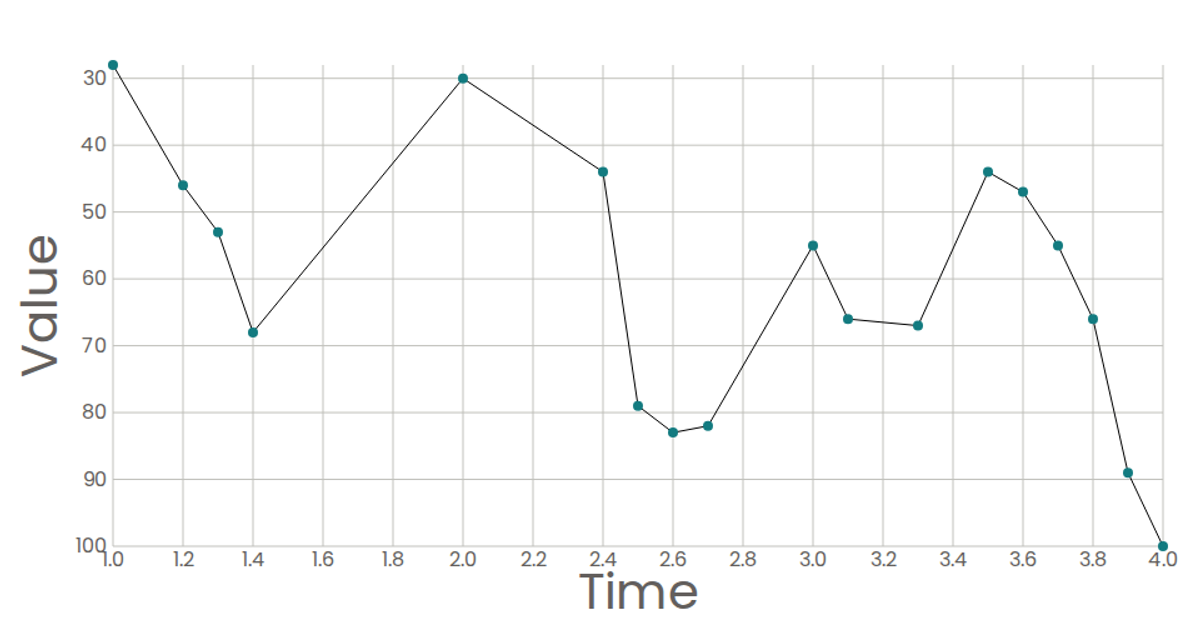
A line chart tracks the ITA metric over time for a Fifa dataset, with a date-based x-axis and a linear y-axis. Built with React and D3 v5, the visualization uses `scaleTime` and `scaleLinear` to map data, while the `line()` generator with `curveNatural` smooths the path. Axes are rendered as SVG groups with tick marks and labels, and the data loads asynchronously via `csv` from a GitHub gist.
AI-generated descriptionA time series plot of Fifa.
MIT Licensed




Comments
Sign in to join the discussion.