🌍 Public
Fork of Responsive Scatter Plot
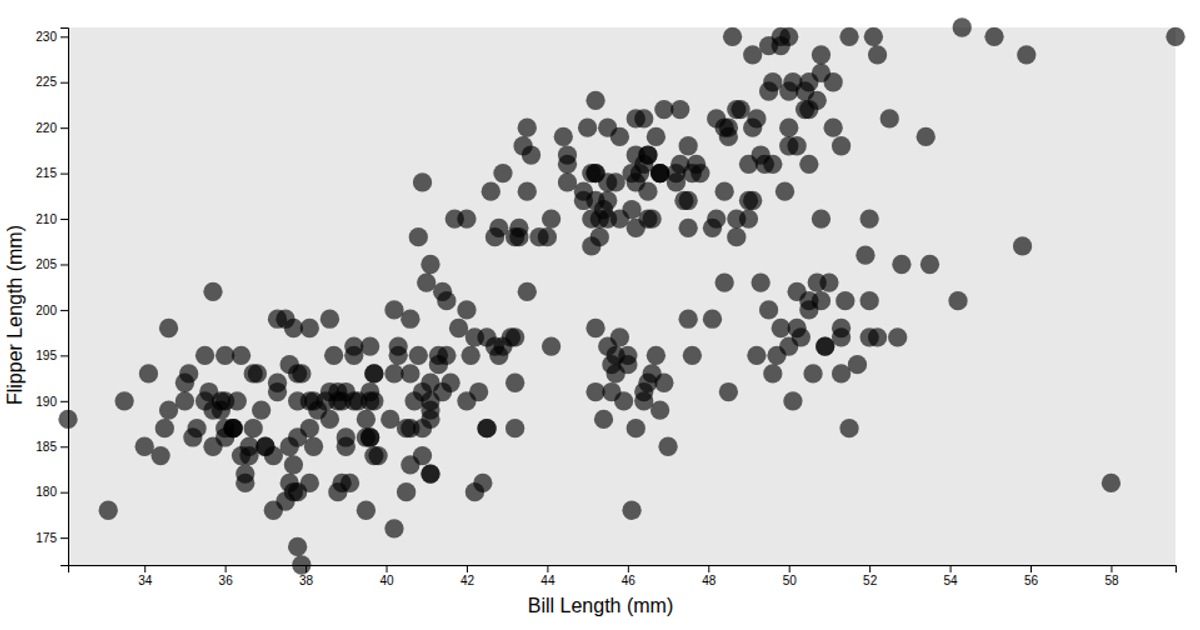
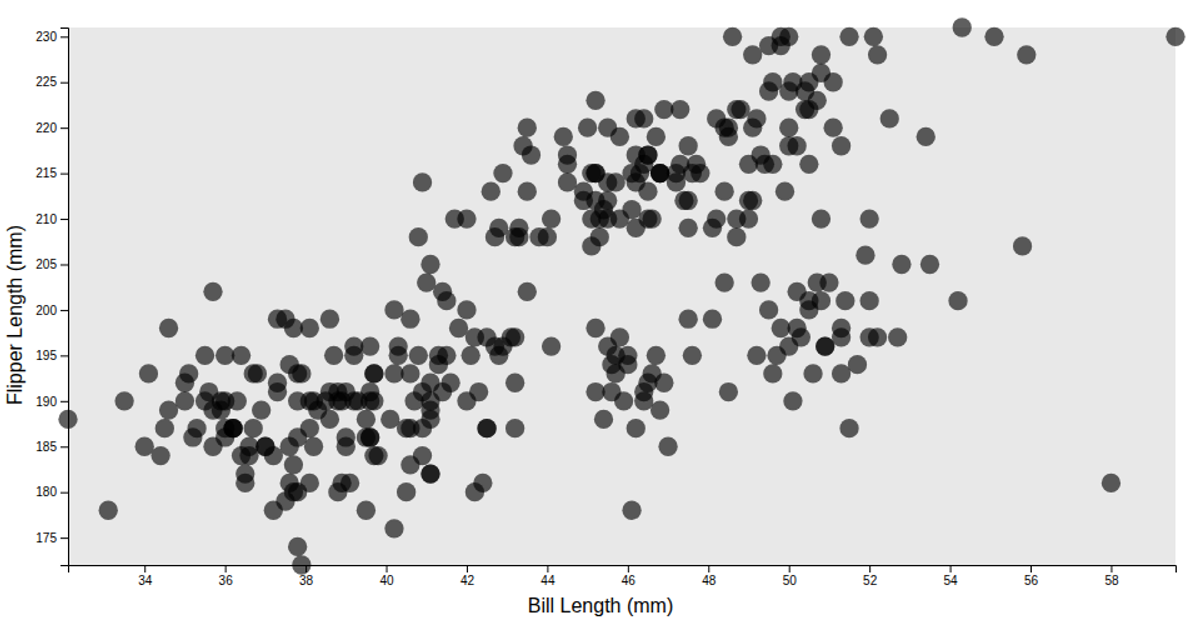
This example visualizes the relationship between bill length and flipper length of penguins from the `@curran/penguins` dataset. The plot uses a responsive scatter plot where each circle represents a penguin, with its position determined by the two measurements. The visualization filters out missing values and uses D3's `scaleLinear` and `axisLeft` to construct the axes, while the `observeResize` utility from `@curran/responsive-axes` handles responsive resizing. The chart includes a light gray inner rectangle background and semi-transparent circles, with labels for both axes indicating the measured traits in millimeters.
AI-generated descriptionA responsive scatter plot.
MIT Licensed





Comments
Sign in to join the discussion.