🌍 Public
Refactored Bar Chart
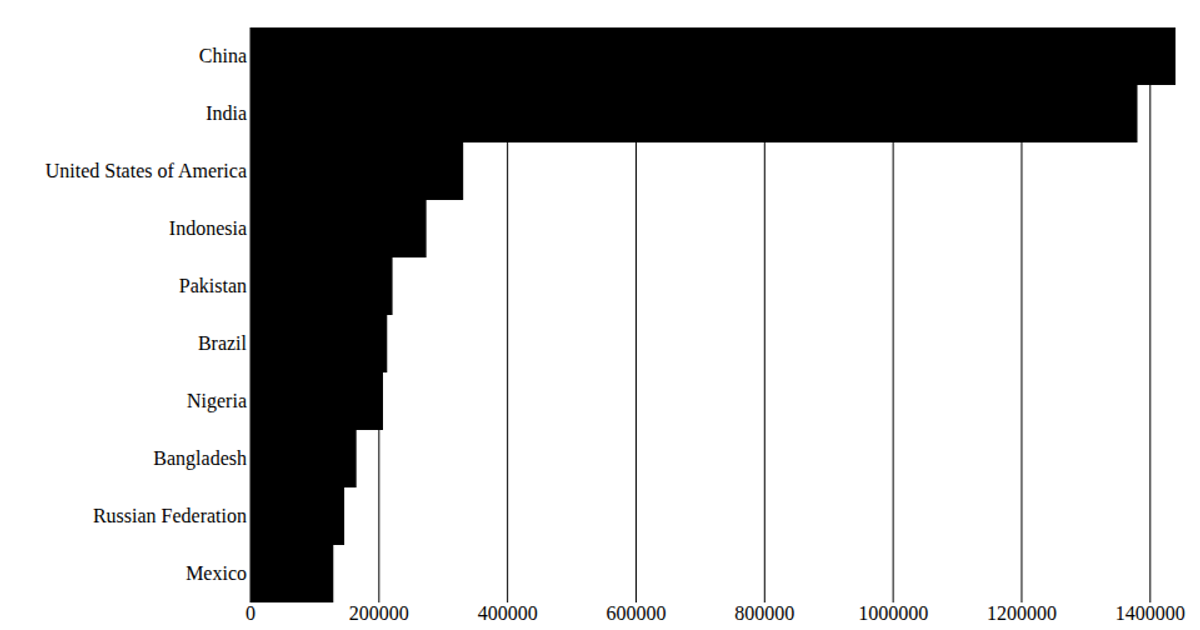
This bar chart displays the top 15 most populous countries in 2020, using data from the United Nations World Population Prospects 2019. The visualization is built with React and D3 v5, leveraging `scaleBand` for the categorical y-axis and `scaleLinear` for the population x-axis. The code is refactored into reusable components for the bottom axis, left axis, and rectangle marks. All elements are rendered as SVG, with the tick lines on the bottom axis styled in red for emphasis.
AI-generated descriptionA program that shows the top 10 most populous countries as a bar chart.
Data: [United Nations World Population Prospects 2019]
(https://gist.github.com/curran/0ac4077c7fc6390f5dd33bf5c06cb5ff).
MIT Licensed



Comments
Sign in to join the discussion.