Task9&10 Question 2
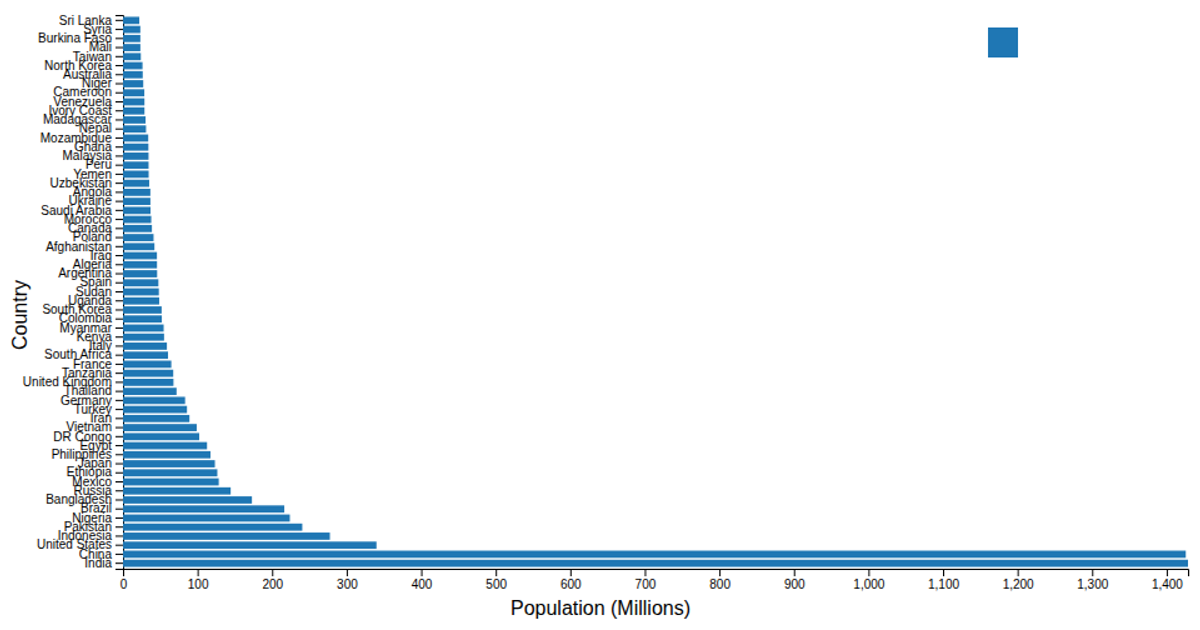
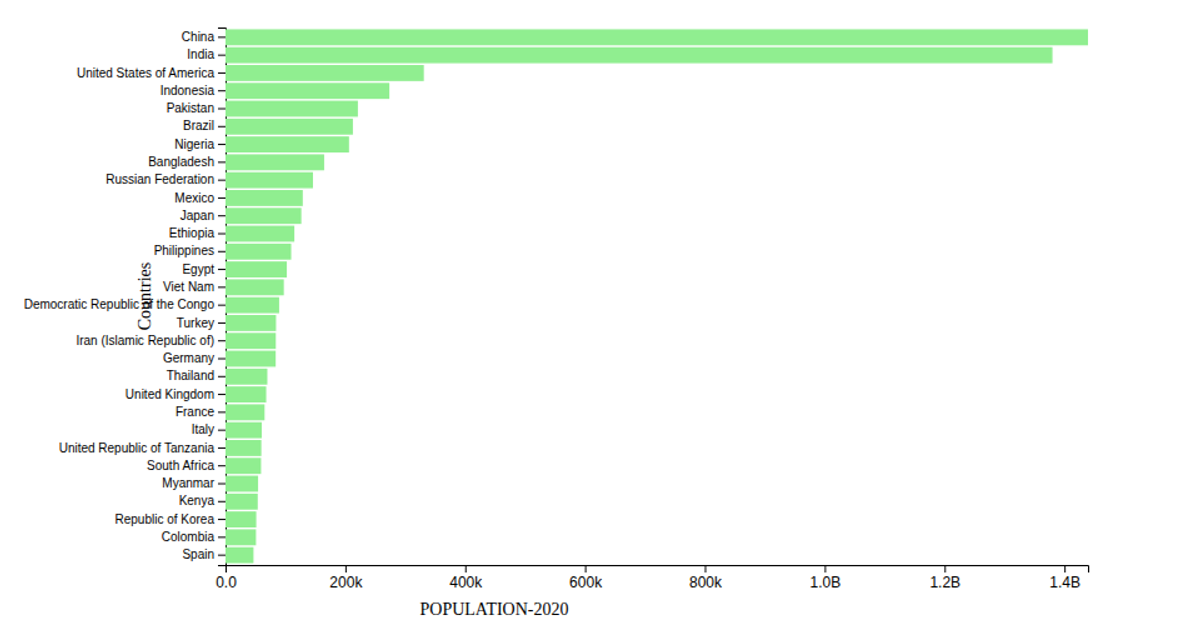
This stacked bar chart displays the population and total COVID-19 cases across six continents, with each bar segmented by continent. Users can hover over the legend to highlight a specific continent, which dims other segments and raises the selected stack. The visualization uses d3.scaleOrdinal for color mapping, d3.stack for bar segmentation, and d3.scaleBand and d3.scaleLinear for axes. Data comes from the included CSV file `covidandworldpopulation.csv`, processed and rendered using d3.select and responsive axes.
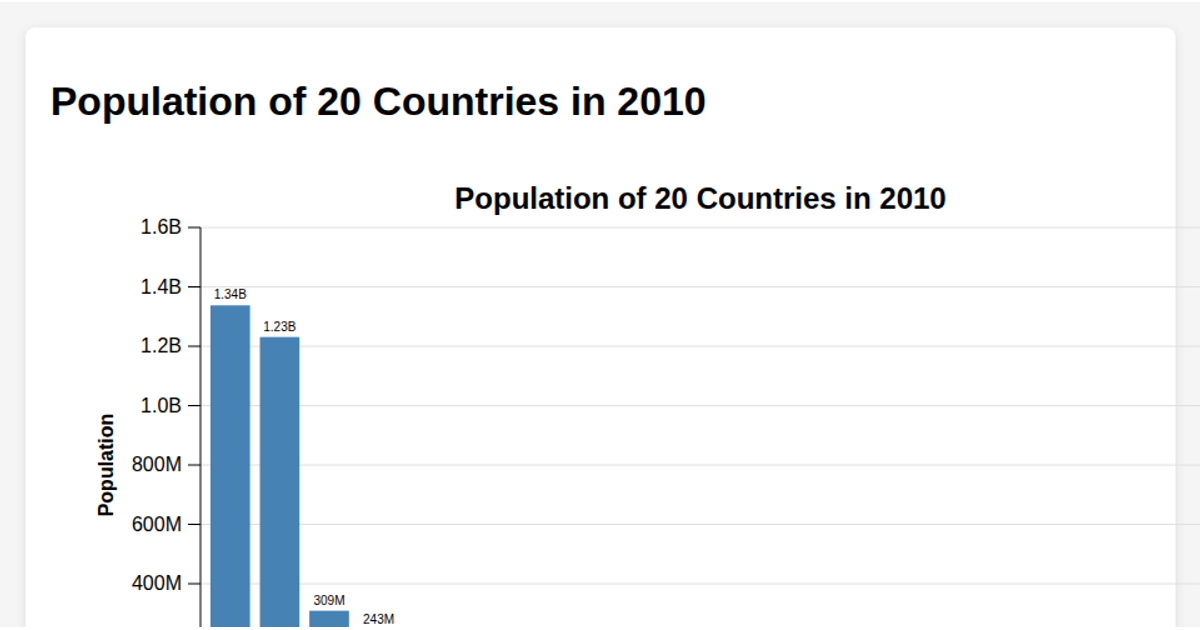
AI-generated descriptionStacked bars showing estimated religion breakdown of the most populous 20 countries in 2010. Based on an example from the tutorial Splitting Charts. Interactions:
- Hover over the legend to highlight religions.
Data is from The Global Religious Landscape by Pew Research, generated using this processing script.


Comments
Sign in to join the discussion.