Skip to main content
Explore
Solutions
Services
Pricing
Quick Start
Demo
Start free
Log in
Send feedback
✕
Tell us what works and what could be better. We read every submission.
Send feedback
✕
Tell us what works and what could be better. We read every submission.
M
Marco Malvicini
@MarcoMalvic
·
22 public vizzes
loading data in react
Apr 24, 2021
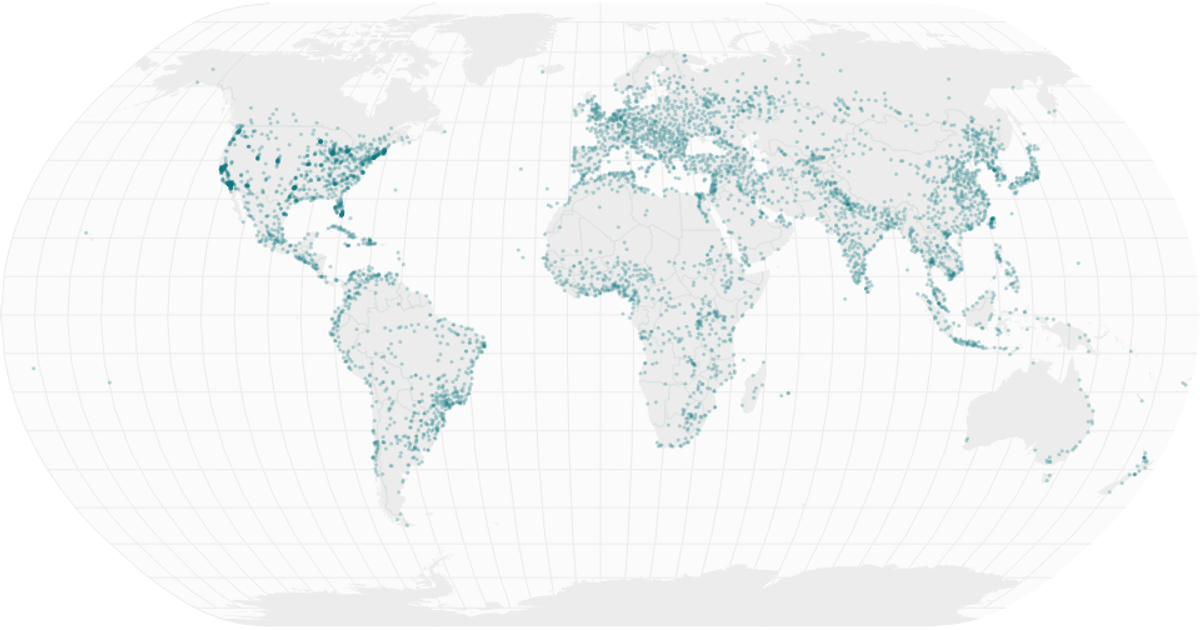
Points on a Map
Apr 19, 2021
Points on a map
Apr 19, 2021
interactive color legend
Apr 19, 2021
Scatterplot with color legend
Apr 19, 2021
Scatterplot with color
Apr 19, 2021
Polished Scatterplot with menus
Apr 19, 2021
Scatterplot with menus
Apr 19, 2021
dropdown menu 1
Apr 19, 2021
Line chart Temp vs Time
Apr 18, 2021
Scatter Plot with Time
Apr 18, 2021
Scatterplot iris dataset
Apr 18, 2021
Stylized barchart
Apr 18, 2021
Refactored barchart
Apr 18, 2021
Axes with D3 React
Apr 17, 2021
D3 React bar chart
Apr 17, 2021
Visualizing data with React & D3
Apr 17, 2021
Fork of Vega-Lite API Template
Apr 17, 2021
course_part2
Apr 16, 2021
parsing csv data with d3
Apr 16, 2021
interaction with react
Apr 16, 2021
Fork of Hello HTML
Apr 16, 2021