🌍 Public
123 of Making a Bar Chart
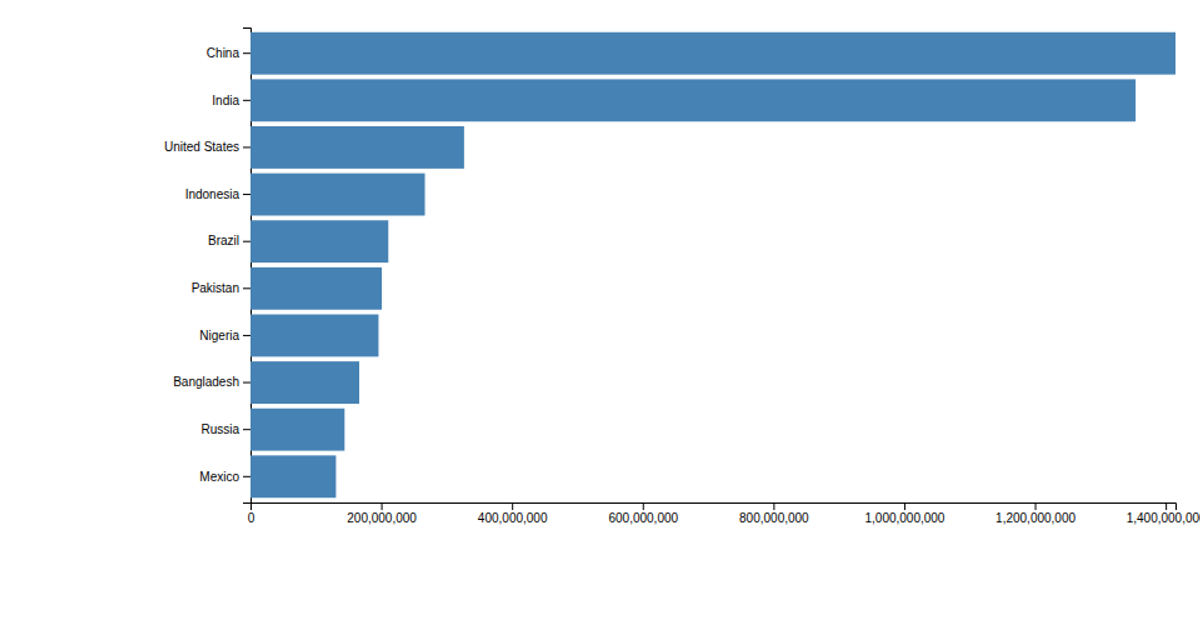
A horizontally oriented bar chart displays the populations of the ten most populous countries, with bars extending from left to right. The chart uses D3 v5’s `scaleLinear` for both the x-axis (population values) and the y-axis (categorical country names), with `axisLeft` for country labels and `axisBottom` for the value scale, all rendered as SVG rectangles. The data is loaded from a CSV file with `csv('data.csv')` and processed by multiplying the population values by 1000. Only the x-axis and y-axis ticks are shown, as the axis lines and tick marks are removed.
AI-generated descriptionMIT Licensed




Comments
Sign in to join the discussion.