🌍 Public
Stylized United Nations Bar Chart
LLeandro Da Souza
Last edited Mar 30, 2021
Created on Mar 30, 2021
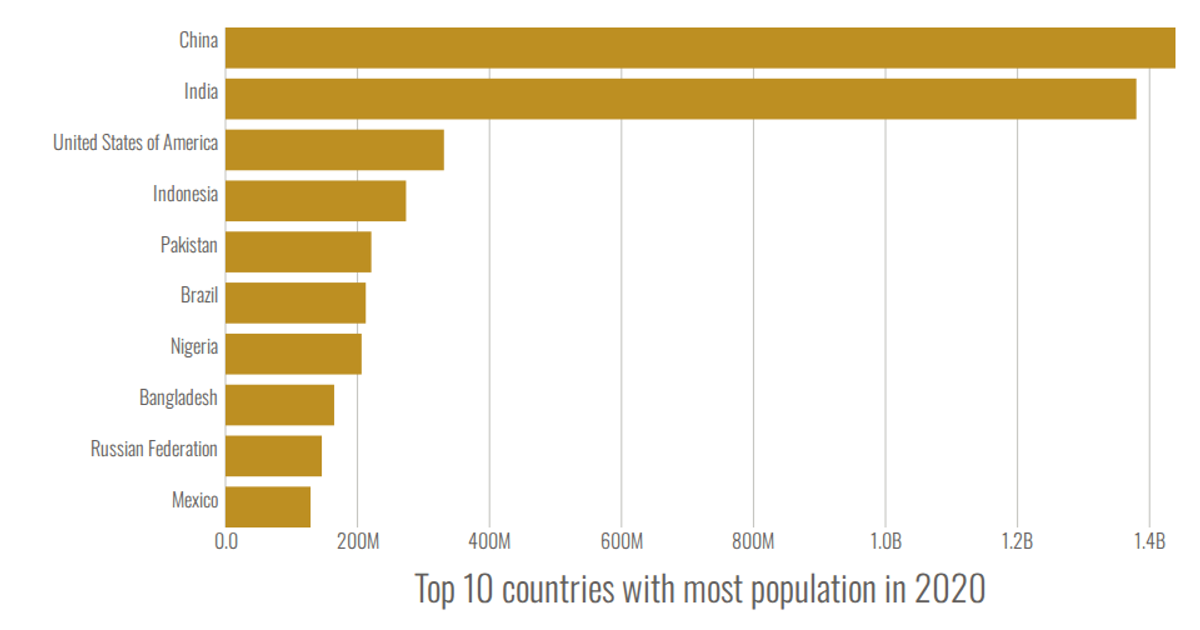
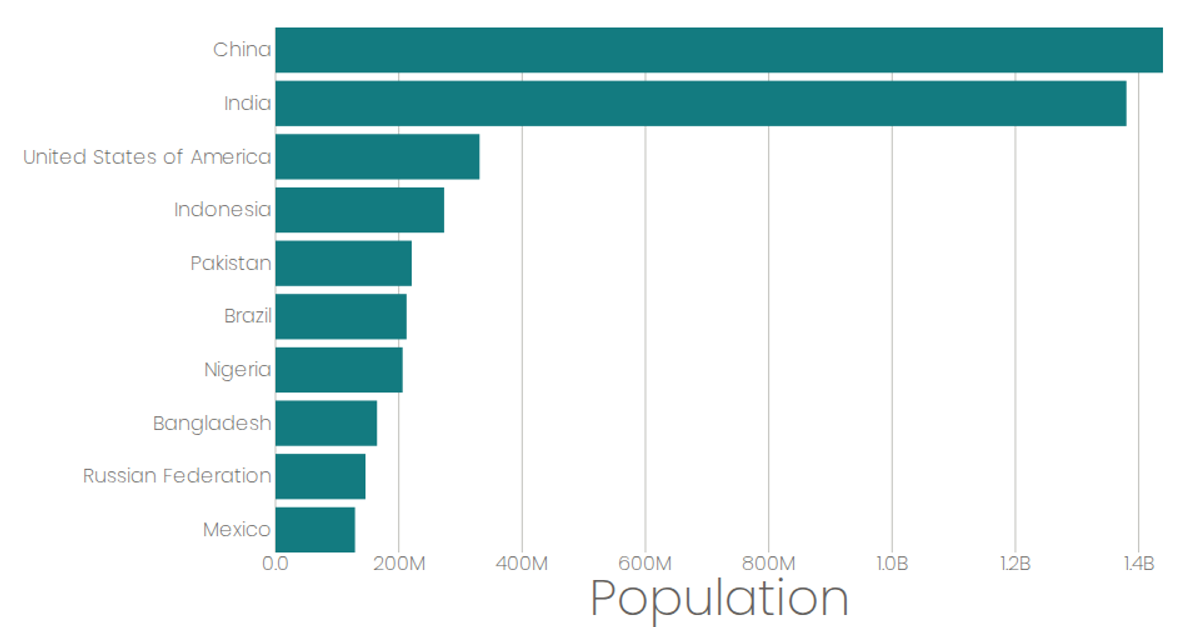
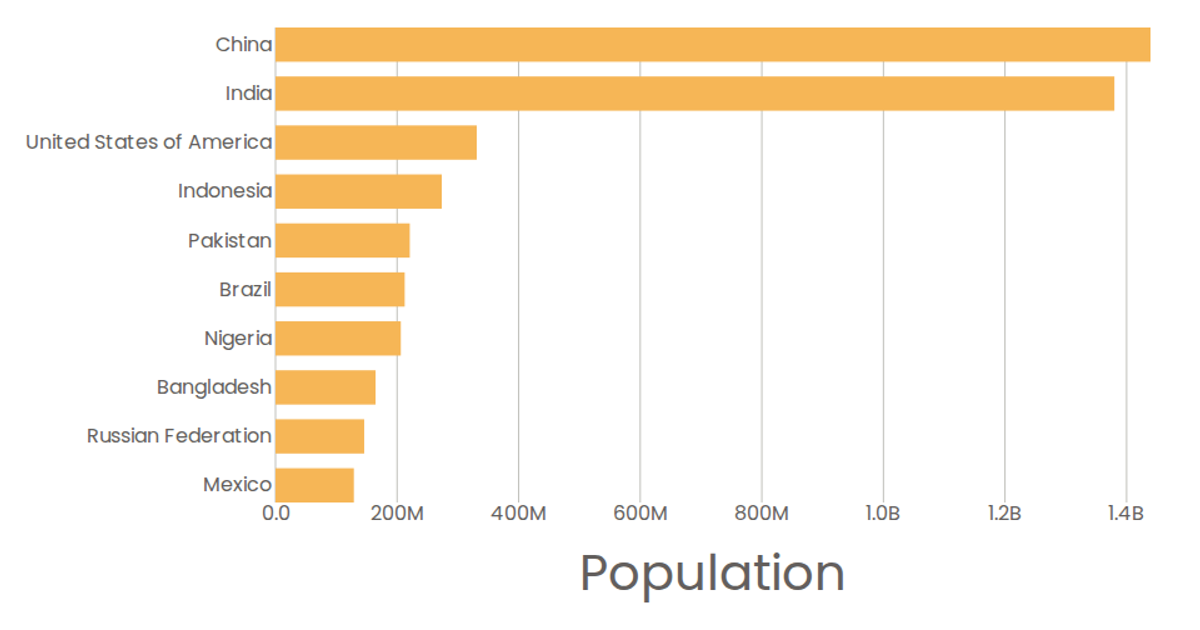
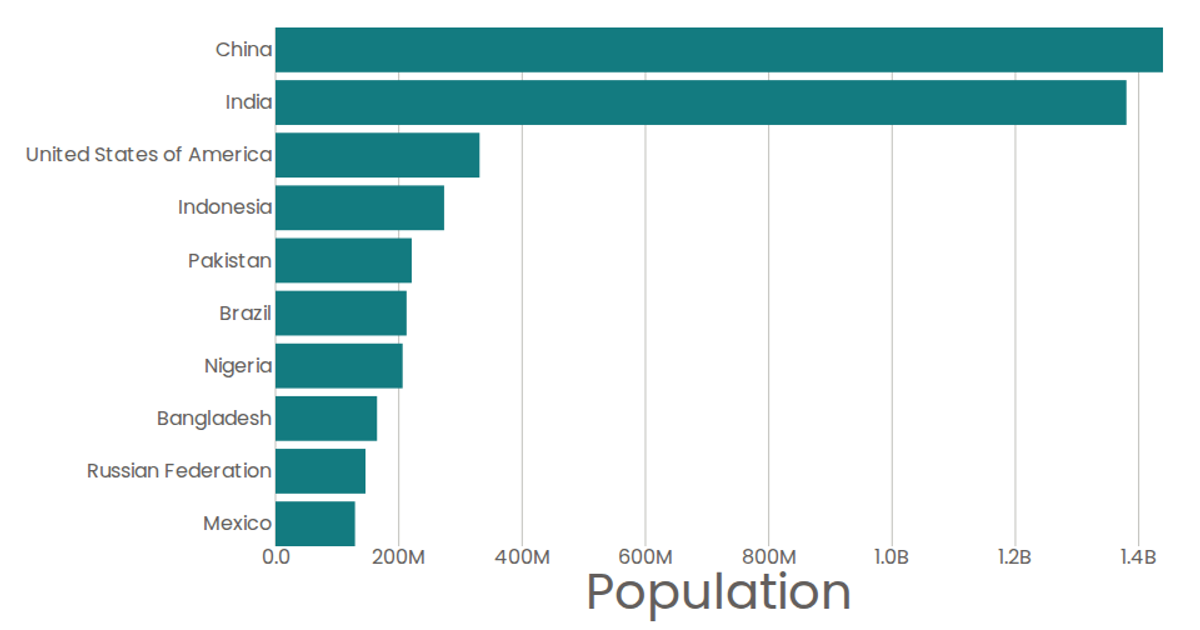
This stylized bar chart displays the population of the top 10 United Nations member states in 2019, using data from a CSV file with 2020 population estimates. The React application uses D3 v6's `scaleBand` and `scaleLinear` to map countries and population values, rendering horizontal bars as SVG rectangles. The code imports `csv` from D3 to fetch the data, applies a custom tick format that converts population values from scientific notation to billions, and includes interactive tooltips via SVG `<title>` elements.
AI-generated descriptionusing React to render and visualize United Nation Population in 2019
I dont know why this doesn't work
MIT Licensed


Comments
Sign in to join the discussion.